In short
This page answers one question: what is actually in this database? It browses the connected database’s dictionary — whatever its model — and gives, for each concept, how many records, how many patients and the distribution of its values. The concepts you keep gather into a concept list that travels with the project.
Knowing what you have before looking for it
A health warehouse describes thousands of possible concepts. Your database holds only a fraction of them, and nothing says in advance which: an ICU warehouse will have ventilation and vasopressors in abundance, and almost nothing in oncology.
Hence the order of operations. Before writing a cohort criterion on “lactate”, you need to know whether lactate is present, under which code, how many times, and with what values. That is what this page gives you.
The database’s dictionary
The page imposes no data model. It reads the dictionary table — or tables — that the database’s schema declares, and adapts to what it finds there.
An OMOP database
The concept table: identifier, name, code, vocabulary, domain, class, standard status. The page shows every one of those columns.
A MIMIC database
d_items and d_labitems, often declared together. No standardized vocabulary, and d_items has no code column: those columns simply do not appear.
A home-grown model
Your own reference table. It only needs an identifier and a label; everything else is optional.
A database can have several dictionaries
When the schema declares more than one, the page brings them together and adds a column saying which dictionary each row came from. On MIMIC, that is how d_items and d_labitems are browsed as one.
With no dictionary declared, the page stays empty
It then reports that no concept table was found. It is the schema mapping that names that table — it must be declared before this page is of any use.
The table
One row per concept, with two columns that carry the page’s whole value:
- Records — how many times this concept appears in the database;
- Patients — how many distinct patients it covers.
The gap between the two is readable. Three hundred thousand heart-rate records for eight hundred patients is continuous monitoring. Eight hundred records for eight hundred patients is a single measurement on admission. The two are not analysed the same way.
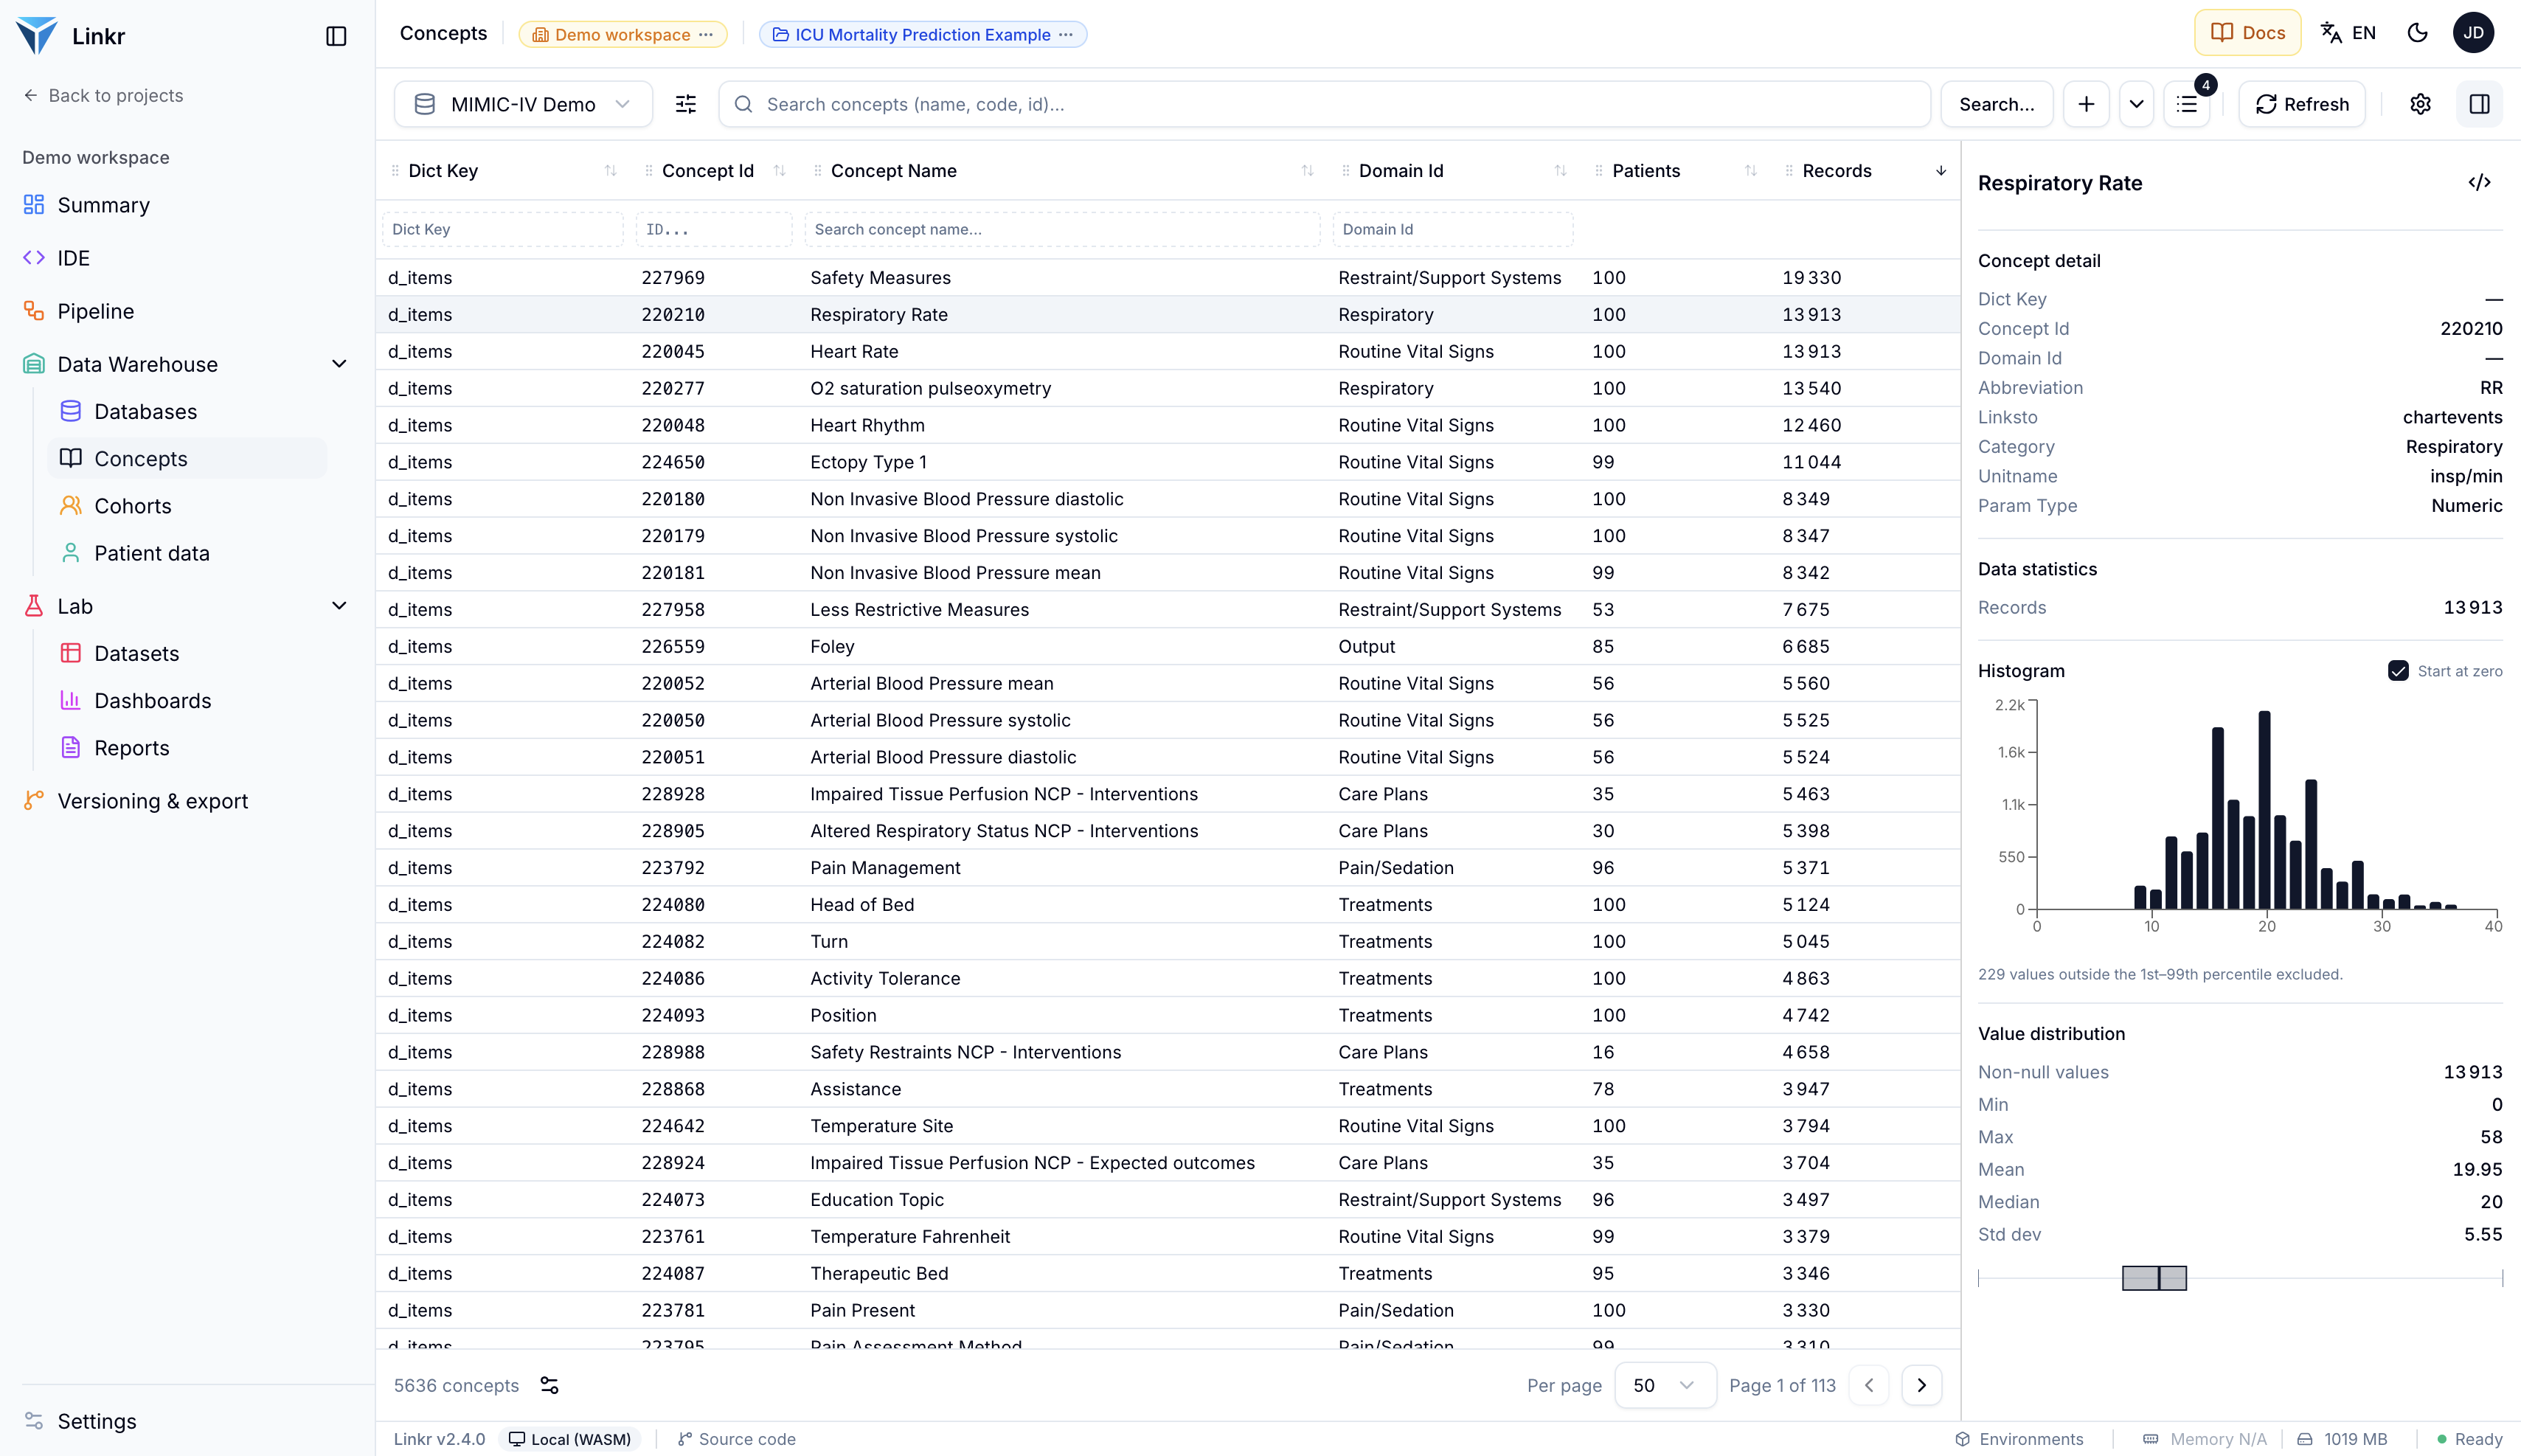
The other columns depend on the dictionary: vocabulary, code, domain, class, validity. They resize, reorder by dragging, and hide.
The database being browsed is chosen at the start of the toolbar, among the project’s: switching database switches the dictionary, and so the columns.
When the model distinguishes a standard code from an original one
Some models, OMOP among them, record an event under two concepts: the standard one and the original source one. Linkr then counts both, and a concept appears in the counts whether it figures under one form or the other. So you do not miss badly aligned data. On a model without that distinction there is only one code, and the question does not arise.
Searching and filtering
Search covers the name, the code and the identifier, tolerating typos.
Search runs on Enter, not as you type
This is deliberate. A full dictionary can exceed a million rows: re-running a fuzzy search on every keystroke would make the page unusable. Type, then press Enter. Esc clears it.
The Filters button, the sliders icon next to the database choice, gathers the dictionary’s filterable columns. Which ones, again, depends on the database: domain and class if the model declares them, vocabulary if it has one, and the Std status — Standard, Classification, Non-standard — on models that carry one. The icon turns coloured as soon as a filter is active.
A click on a row opens its details. Ctrl or Cmd + click adds a row to the selection, Shift + click selects a range: the right-hand panel then reads N concepts selected, ready to go into a list.
| Vocabulary Id | Concept Id | Concept Name | Concept Code | Domain Id | Concept Class Id | Std | Patients | Records |
|---|---|---|---|---|---|---|---|---|
| LOINC | 3047181 | Lactate [Moles/volume] in Blood | 32693-4 | Measurement | Lab Test | S | 78 | 1,842 |
| LOINC | 3016723 | Creatinine [Mass/volume] in Serum or Plasma | 2160-0 | Measurement | Lab Test | S | 96 | 2,184 |
| LOINC | 3000963 | Hemoglobin [Mass/volume] in Blood | 718-7 | Measurement | Lab Test | S | 92 | 1,576 |
| LOINC | 3027018 | Heart rate | 8867-4 | Measurement | Clinical Observation | S | 100 | 48,210 |
| SNOMED | 132797 | Sepsis | 91302008 | Condition | Clinical Finding | S | 41 | 312 |
| SNOMED | 201826 | Type 2 diabetes mellitus | 44054006 | Condition | Clinical Finding | S | 34 | 268 |
| RxNorm | 1321341 | Norepinephrine | 7512 | Drug | Ingredient | S | 52 | 487 |
| ICD10CM | 45600511 | Sepsis, unspecified organism | A41.9 | Condition | 4-char billing code | NS | 38 | 290 |
Concept detail
Data statistics
A concept’s details
Clicking a row opens the right-hand panel: the concept’s metadata, then its statistics.
For a concept carrying a numeric value — a lab result, a vital sign — Linkr computes minimum, maximum, mean, median, standard deviation, and draws a histogram.
It is an immediate quality check. A creatinine averaging 1.2 is in mg/dL; averaging 105, in µmol/L. A weight reaching 7,000 signals grams mixed in with kilograms. These problems are visible on the histogram in seconds, and cost weeks when discovered after the analysis.
Exclude outliers to read the chart
A single absurd value flattens the whole histogram. The Exclude outliers option clips it to the 1st–99th percentiles, and a line under the chart says how many values were left out. Only the histogram changes: minimum, maximum and mean are still computed on every value. Use it to read the distribution — but the outliers themselves still need dealing with.
Under the figures, a box plot sums up the same distribution: the box runs from the first to the third quartile, the line marks the median, the whiskers the minimum and maximum. Start at zero, above the histogram, chooses between an axis starting at zero and one tightened on the values.
The SQL icon, right of the name, shows the queries behind these statistics, useful to check what is being counted, or to reuse the query elsewhere.
LOINC
Data statistics
Histogram
Value distribution
Concepts settings
Stats
Compute record counts and value distributions for the selected concept. Turn off to browse faster.
Exclude outliers
Clip the histogram to the 1st–99th percentile, so a single absurd value does not flatten the chart.
Both switches live in Concepts settings, the gear icon in the toolbar, General tab: Stats turns the computation off to browse many concepts faster, and Exclude outliers applies to the histogram of every concept you browse.
Building the list
Counting each concept’s occurrences across a whole warehouse is expensive. In server mode Linkr therefore computes these counts once and keeps them.
On a fresh database a banner says the list has not been built yet and offers to build it — an operation that can take a while on a large database. A Refresh button rebuilds it afterwards, showing the last refresh date.
Refresh after loading data into the database
The counts date from the last build. After new data is loaded by an ETL pipeline, the page still shows the old figures until you refresh.
Gathering concepts into a list
As you browse, you spot the concepts that matter to you: the six codes standing for mechanical ventilation, the four ways a creatinine is recorded. A concept list gathers them.
Select one or more rows, then + — or Enter — to add them to the active list; hovering says which one. The arrow beside it picks another destination list or creates one (New list). The list button, with its counter, opens the Concept list window.
In that window a list is chosen, renamed with the pencil, deleted, emptied with Clear, and above all copied as SQL, R or Python. This is the biggest time-saver: your thirty ventilation codes land in a script without a single manual retype, each followed by a comment recalling its vocabulary and name.
Concept list
| Vocabulary Id | ID | Name | Code | |
|---|---|---|---|---|
| LOINC | 3047181 | Lactate [Moles/volume] in Blood | 32693-4 | |
| LOINC | 3016723 | Creatinine [Mass/volume] in Serum or Plasma | 2160-0 | |
| LOINC | 3000963 | Hemoglobin [Mass/volume] in Blood | 718-7 |
Clipboard
IN ( 3047181 -- LOINC - Lactate [Moles/volume] in Blood , 3016723 -- LOINC - Creatinine [Mass/volume] in Serum or Plasma , 3000963 -- LOINC - Hemoglobin [Mass/volume] in Blood)Copying by identifier or by code
Both are offered when the dictionary has a code column. When it does not — d_items on MIMIC, for instance — only the identifier is available: copying codes would produce nothing but empty strings.
A list travels with the project
It is exported, versioned and shared with it. The work of finding those concepts — often several hours — therefore passes to whoever takes the project on, instead of being redone.
Concept list and concept set: two different things
The names look alike. They do not play the same role.
Concept list
Yours, built by hand.
Attached to the project. You fill it while browsing the table, you change it at will, and it leaves with the project.
Concept set
Imported, read-only.
Comes from a data dictionary installed in the workspace — a reference published by a research network. Shared by every project.
Put differently: a concept set is a reference you receive, a concept list is a selection you produce.
Enriching the table with a reference
Concepts settings, Data dictionary tab, let you import a data dictionary — not to be confused with the database’s own dictionary, which comes from the schema. This one is an external reference: its concept sets appear as extra columns — name, category, subcategory.
Matching is done on the concept’s vocabulary and code. Those columns are therefore only offered if the database declares both.
The benefit: you see immediately that a concept belongs to the “inflammatory markers” group defined by the reference, without having to know it. The concept set’s name is clickable and opens its details.
The reference is shared by the whole workspace
The page holds only one at a time. Update re-imports the reference — a new version of the same dictionary — without removing anything; Replace swaps it for another. Since concept sets are shared with every project in the workspace — including concept mapping projects — that replacement affects them all, and cannot be undone. The old one is only deleted once the new one has landed: cancelling the import breaks nothing.
A concept list does not yet fill a cohort criterion
A cohort criterion’s concepts are picked independently. For now a list serves patient data tracking and export into your scripts — not filling in a criterion.
Going further
- Schemas — declaring a database’s dictionary, without which this page stays empty.
- Cohorts — using a concept found here as a criterion.
- Concept mapping — matching your local codes to a standard terminology.
- Introduction to OMOP — one standard data model and its terminologies.