Summary
Open the online demo: it comes with a demo workspace already filled in — two MIMIC-IV databases, three example projects, an ETL pipeline and a concept mapping project. Everything runs in your browser: no install, no account, no data sent to a server.
Requirements
A recent browser: Firefox, Safari, Chrome or Edge. Nothing else.
Getting started
Open the demo
Go to demo.linkr.interhop.org. The first load takes a few seconds.
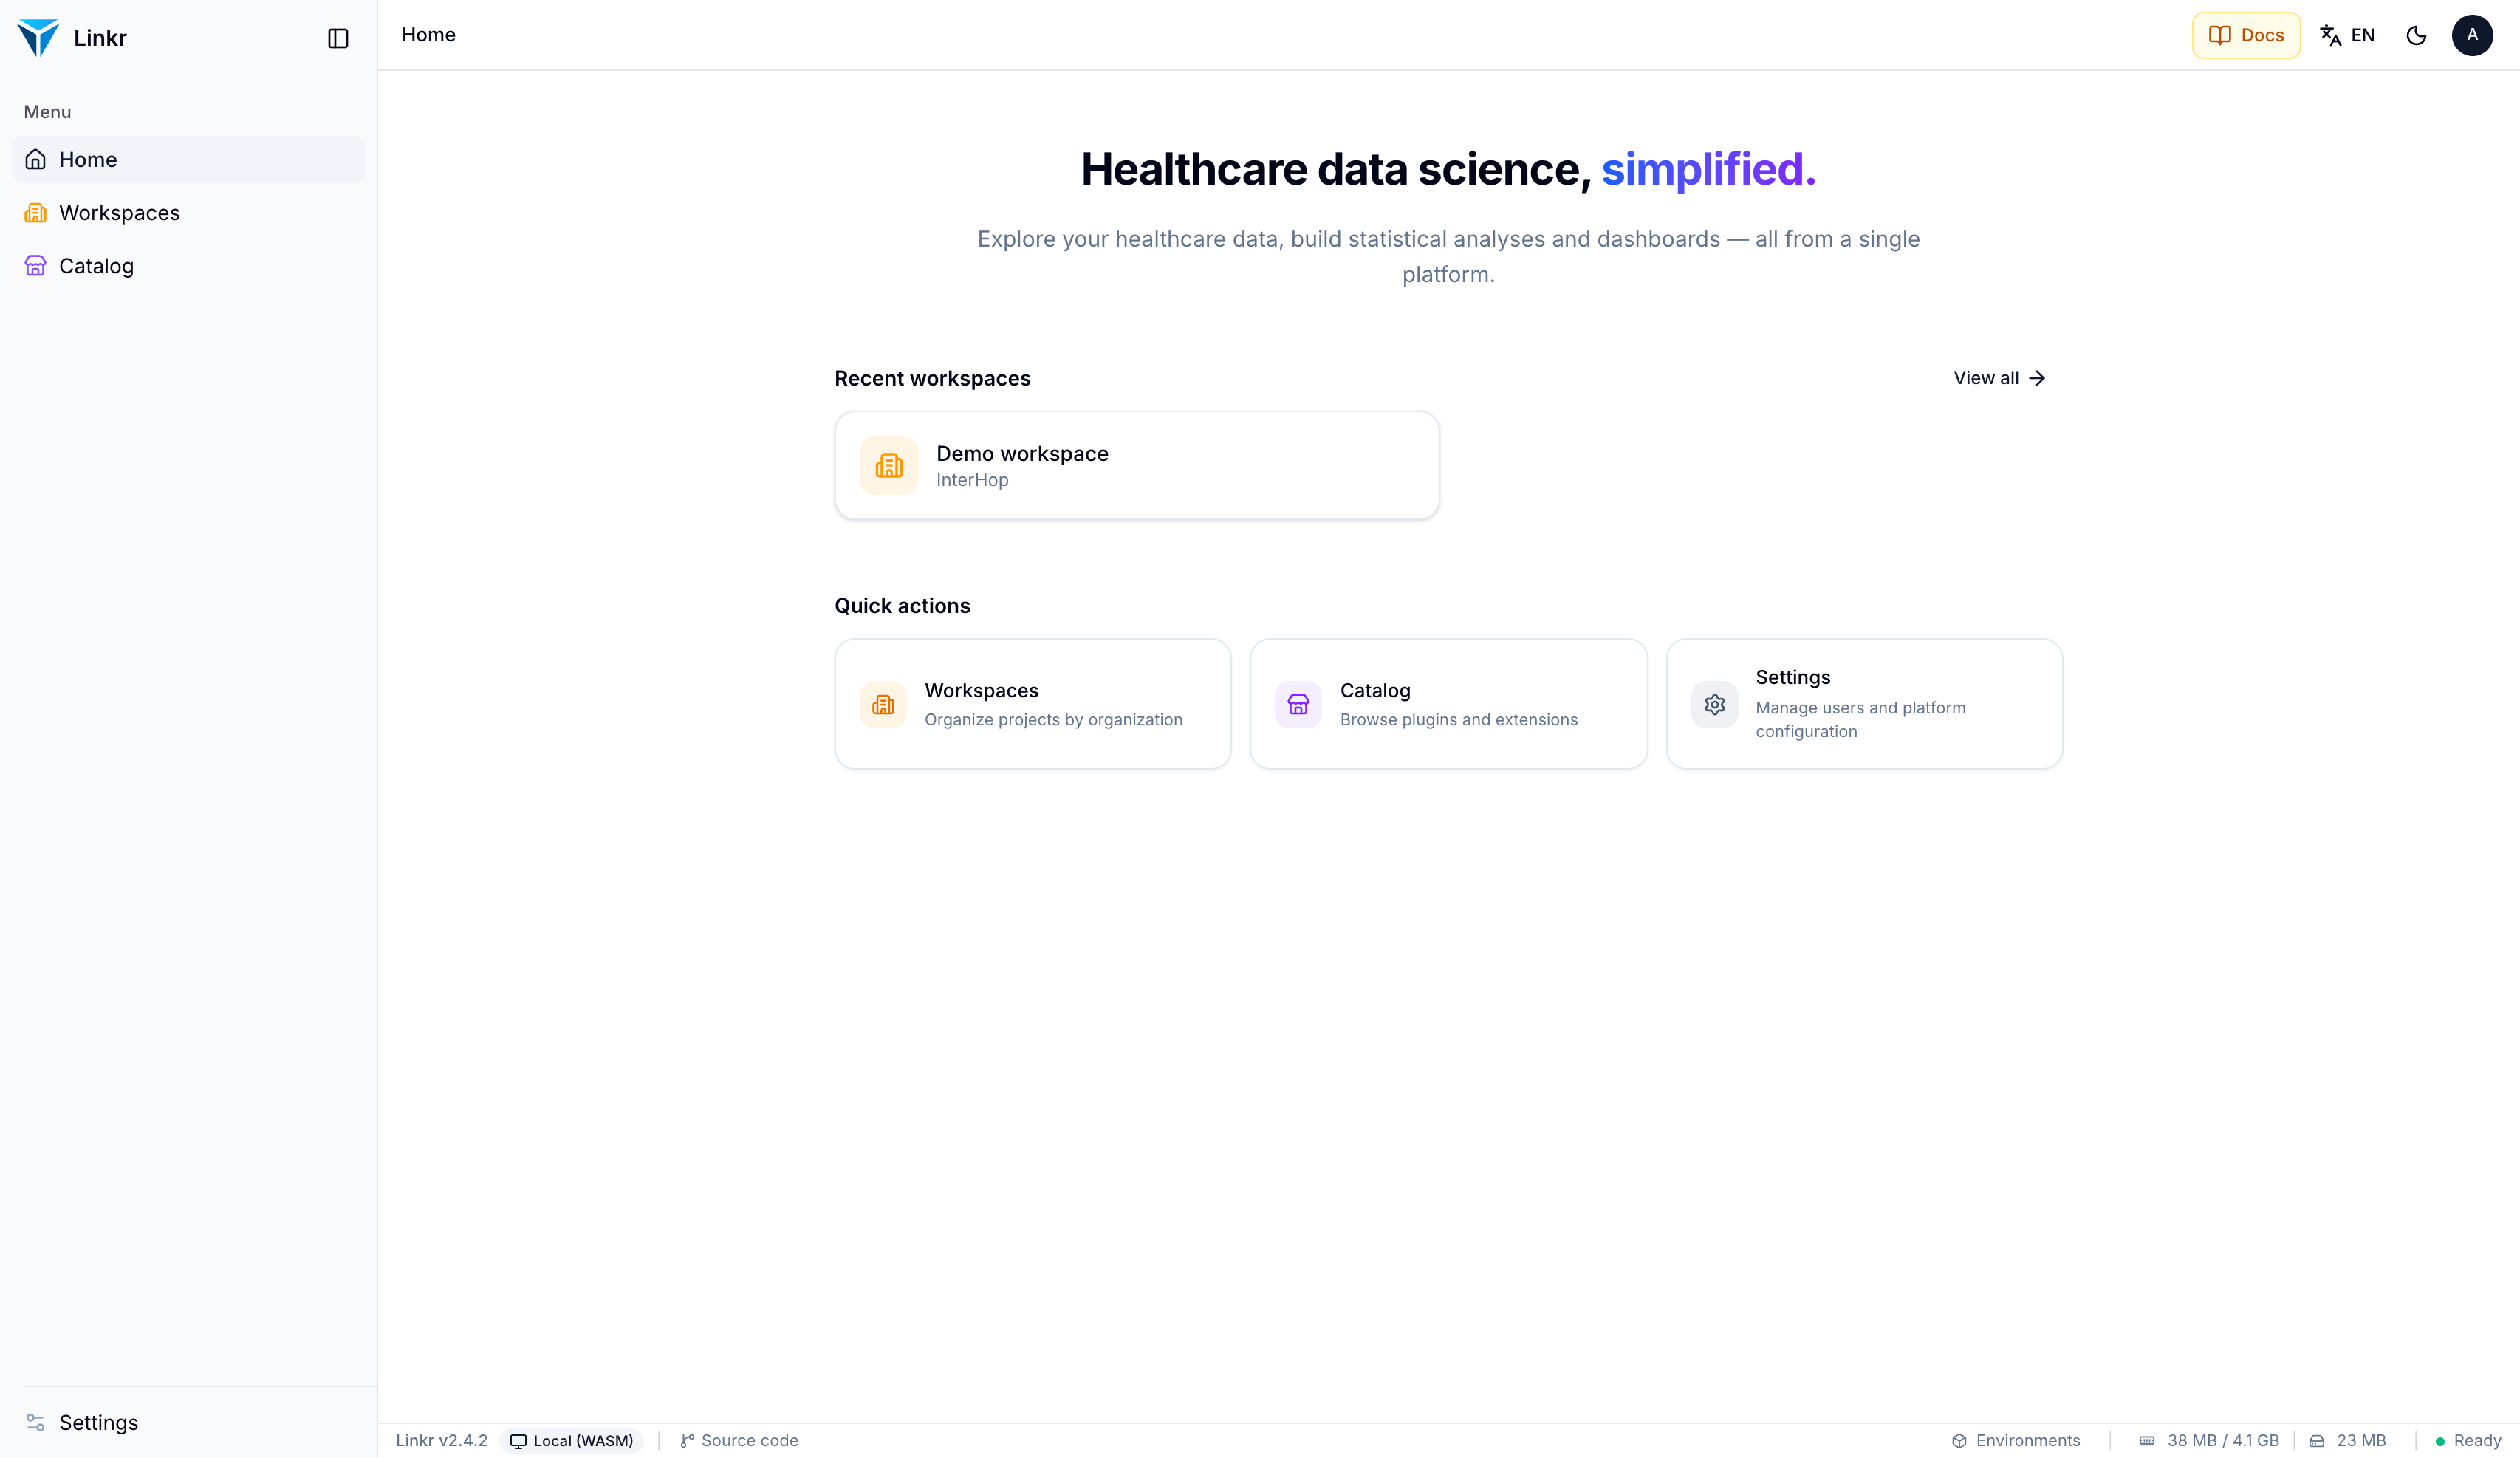
Open the demo workspace
On the home page it appears under Recent workspaces; otherwise, open Workspaces from the menu.
Open an example project
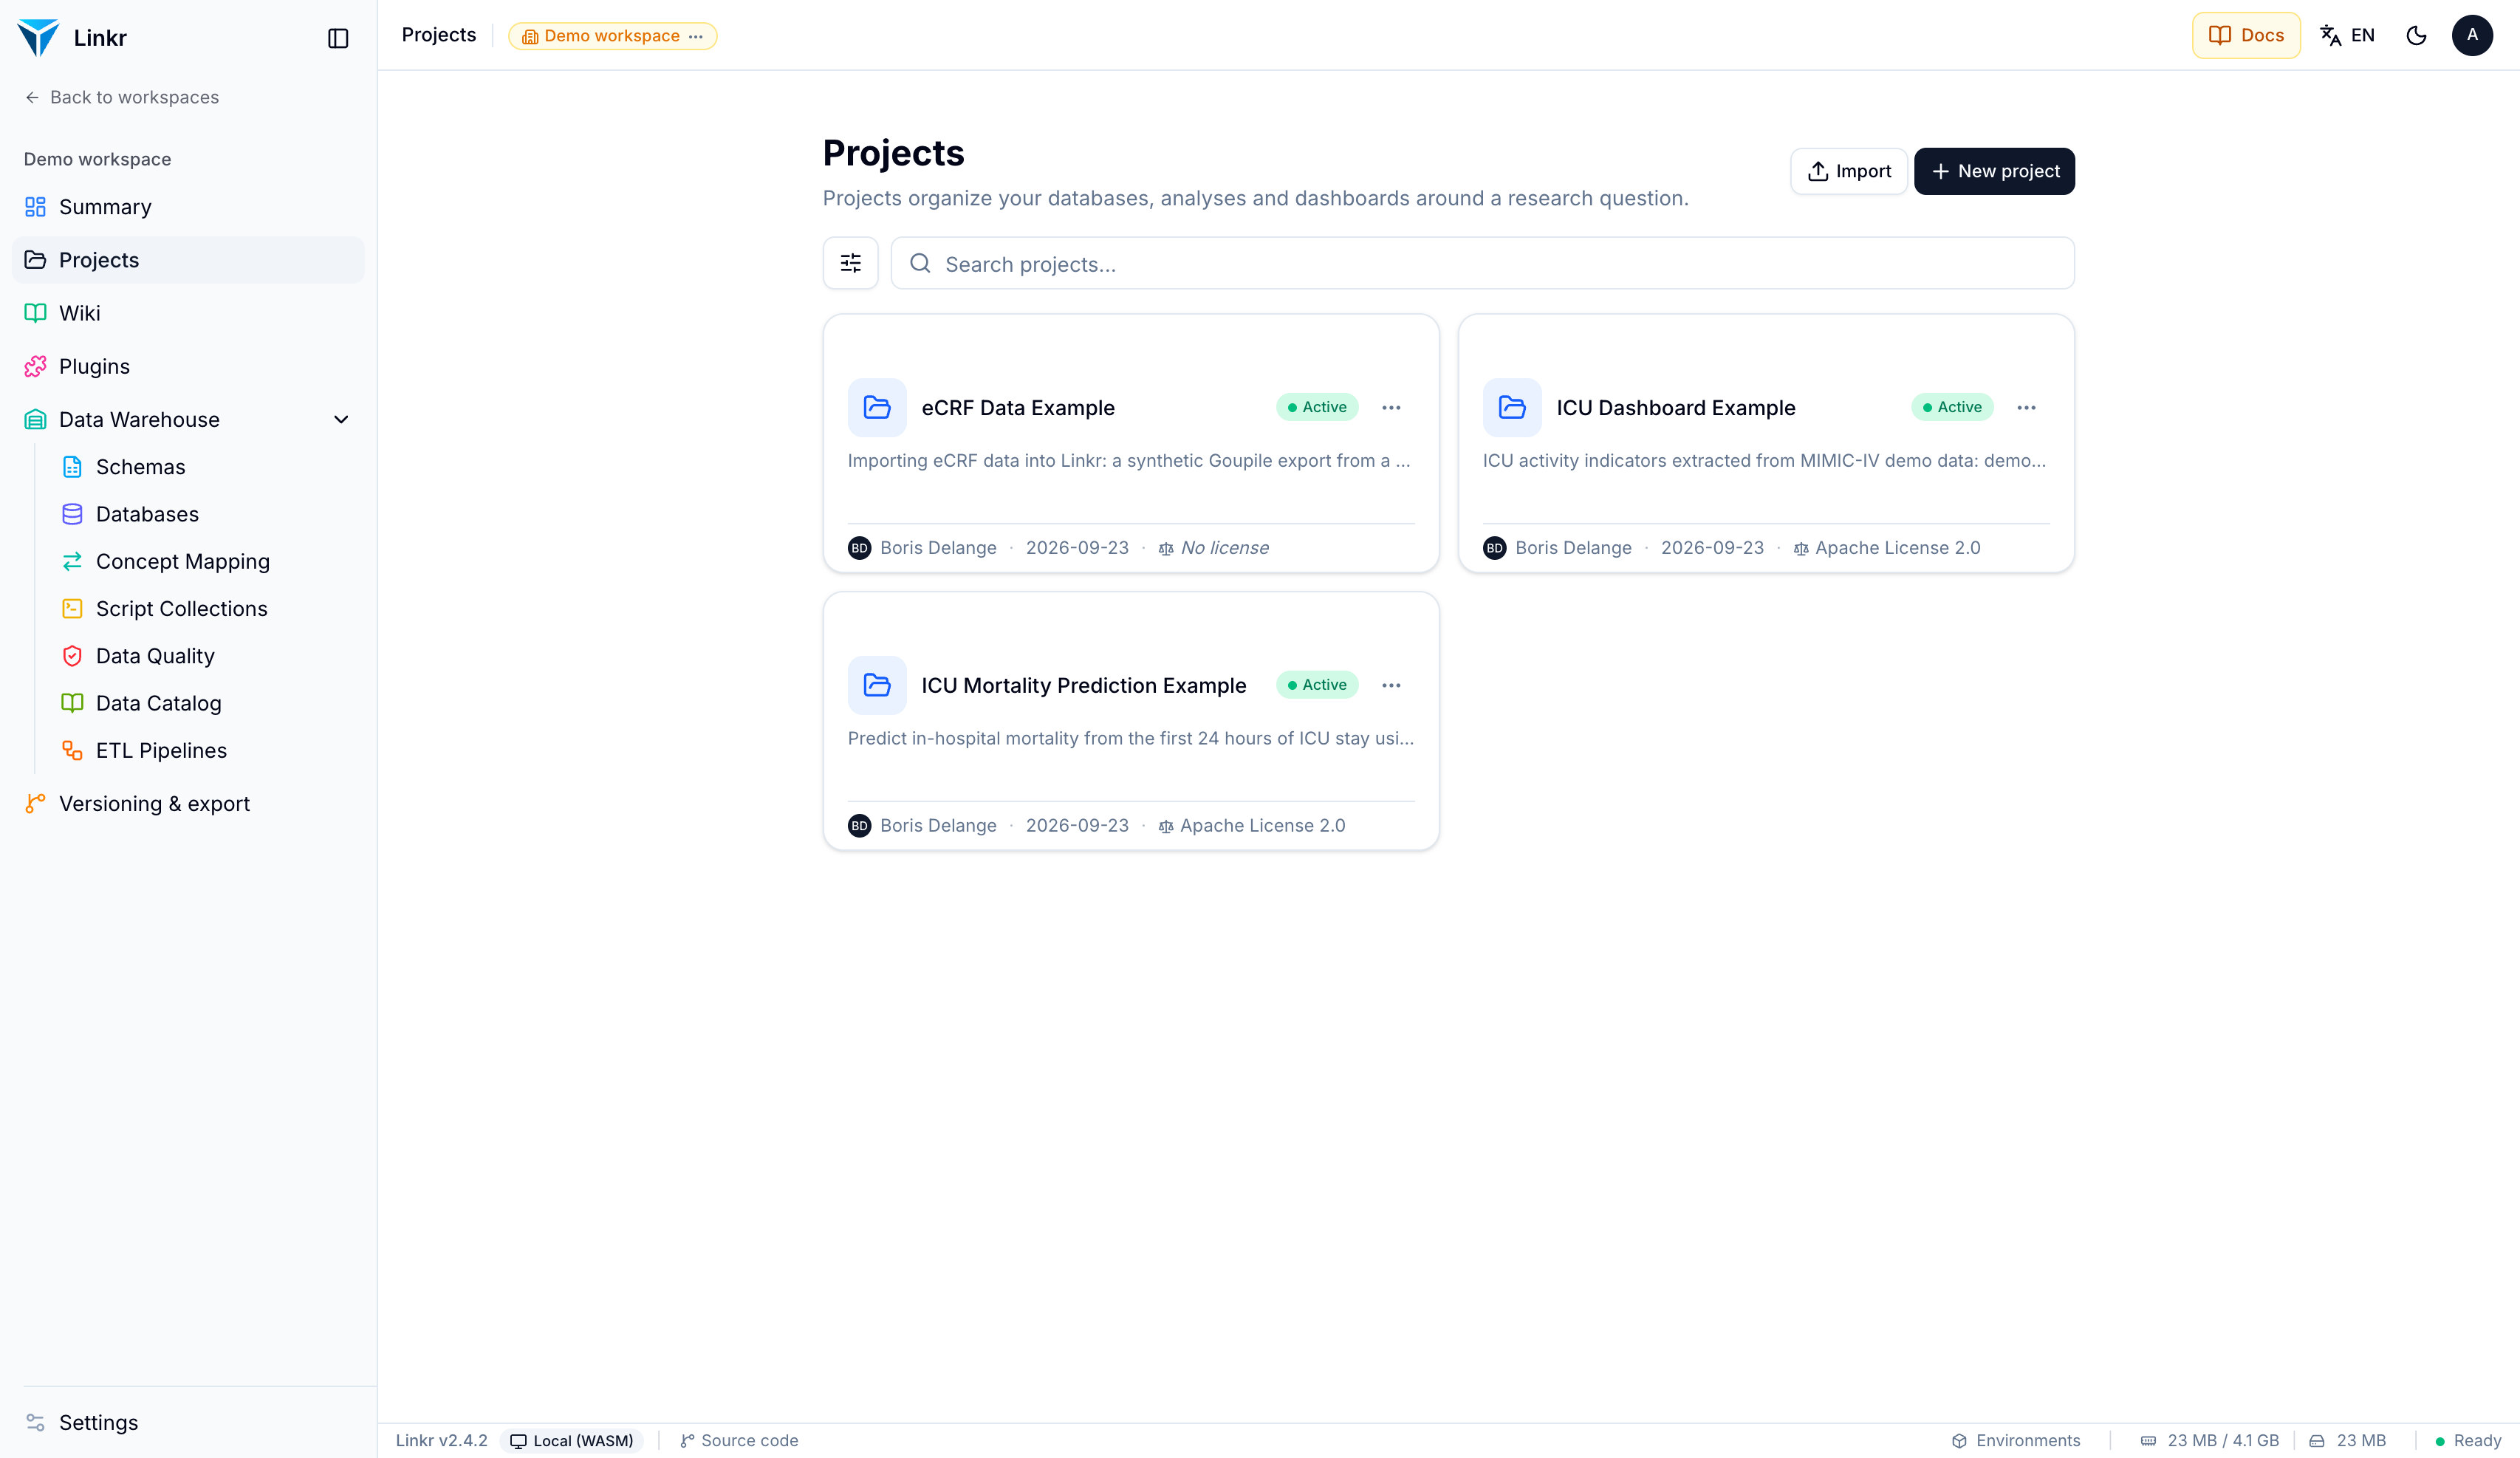
In the workspace, open Projects and pick one of the three projects described below. Each opens on its Summary page, with a README explaining what it contains.
You're in Linkr
The rest of this page describes what the demo contains and where to start. You can also create your own workspace with New workspace, or a blank project with New project.
What you can explore in the demo
The example projects cover four sides of Linkr:
- Explore a health data warehouse — databases, concepts, cohorts and the individual patient record, on 100 MIMIC-IV patients.
- Analyse the data — datasets, no-code statistical analyses, and R or Python code in the IDE.
- Build a dashboard — indicators, charts and filters to follow a clinical activity.
- Collect and analyse a survey — an eCRF export turned into results.
Each is walked through screen by screen in the Explore the demo pages.
Demonstration results, not clinical results
The MIMIC-IV demo dataset holds only 100 patients. The metrics shown by the prediction project demonstrate that the pipeline works end to end; they do not establish clinical performance. The project’s README goes into detail.
The demo data
The projects draw on resources shared by the whole workspace, found in its Data Warehouse menu:
Two MIMIC-IV demo databases
The same 100 patients, in two formats: the native MIMIC-IV schema, and its conversion to the OMOP CDM.
An ETL pipeline
The transformation of MIMIC-IV demo into OMOP CDM, step by step.
A concept mapping project
MIMIC-IV source codes mapped to OMOP standard concepts.
Four schemas
The structure descriptions of OMOP CDM 5.3 and 5.4, MIMIC-III and MIMIC-IV.
To understand these notions — database, schema, mapping, ETL — see Workspaces and projects and The data pipeline.
Finding your way in a project
A project’s sidebar is organised in two groups: the data warehouse, where you explore what exists, and the lab, where you build.
Summary
The project's status, README, licence and tasks. It is the project's home page.
IDE
Write and run R or Python, right in the browser. The terminal requires server mode.
Data Warehouse
Databases, concepts, cohorts and patient-level data, read-only.
Lab
Datasets, dashboards and reports: where your results are written.
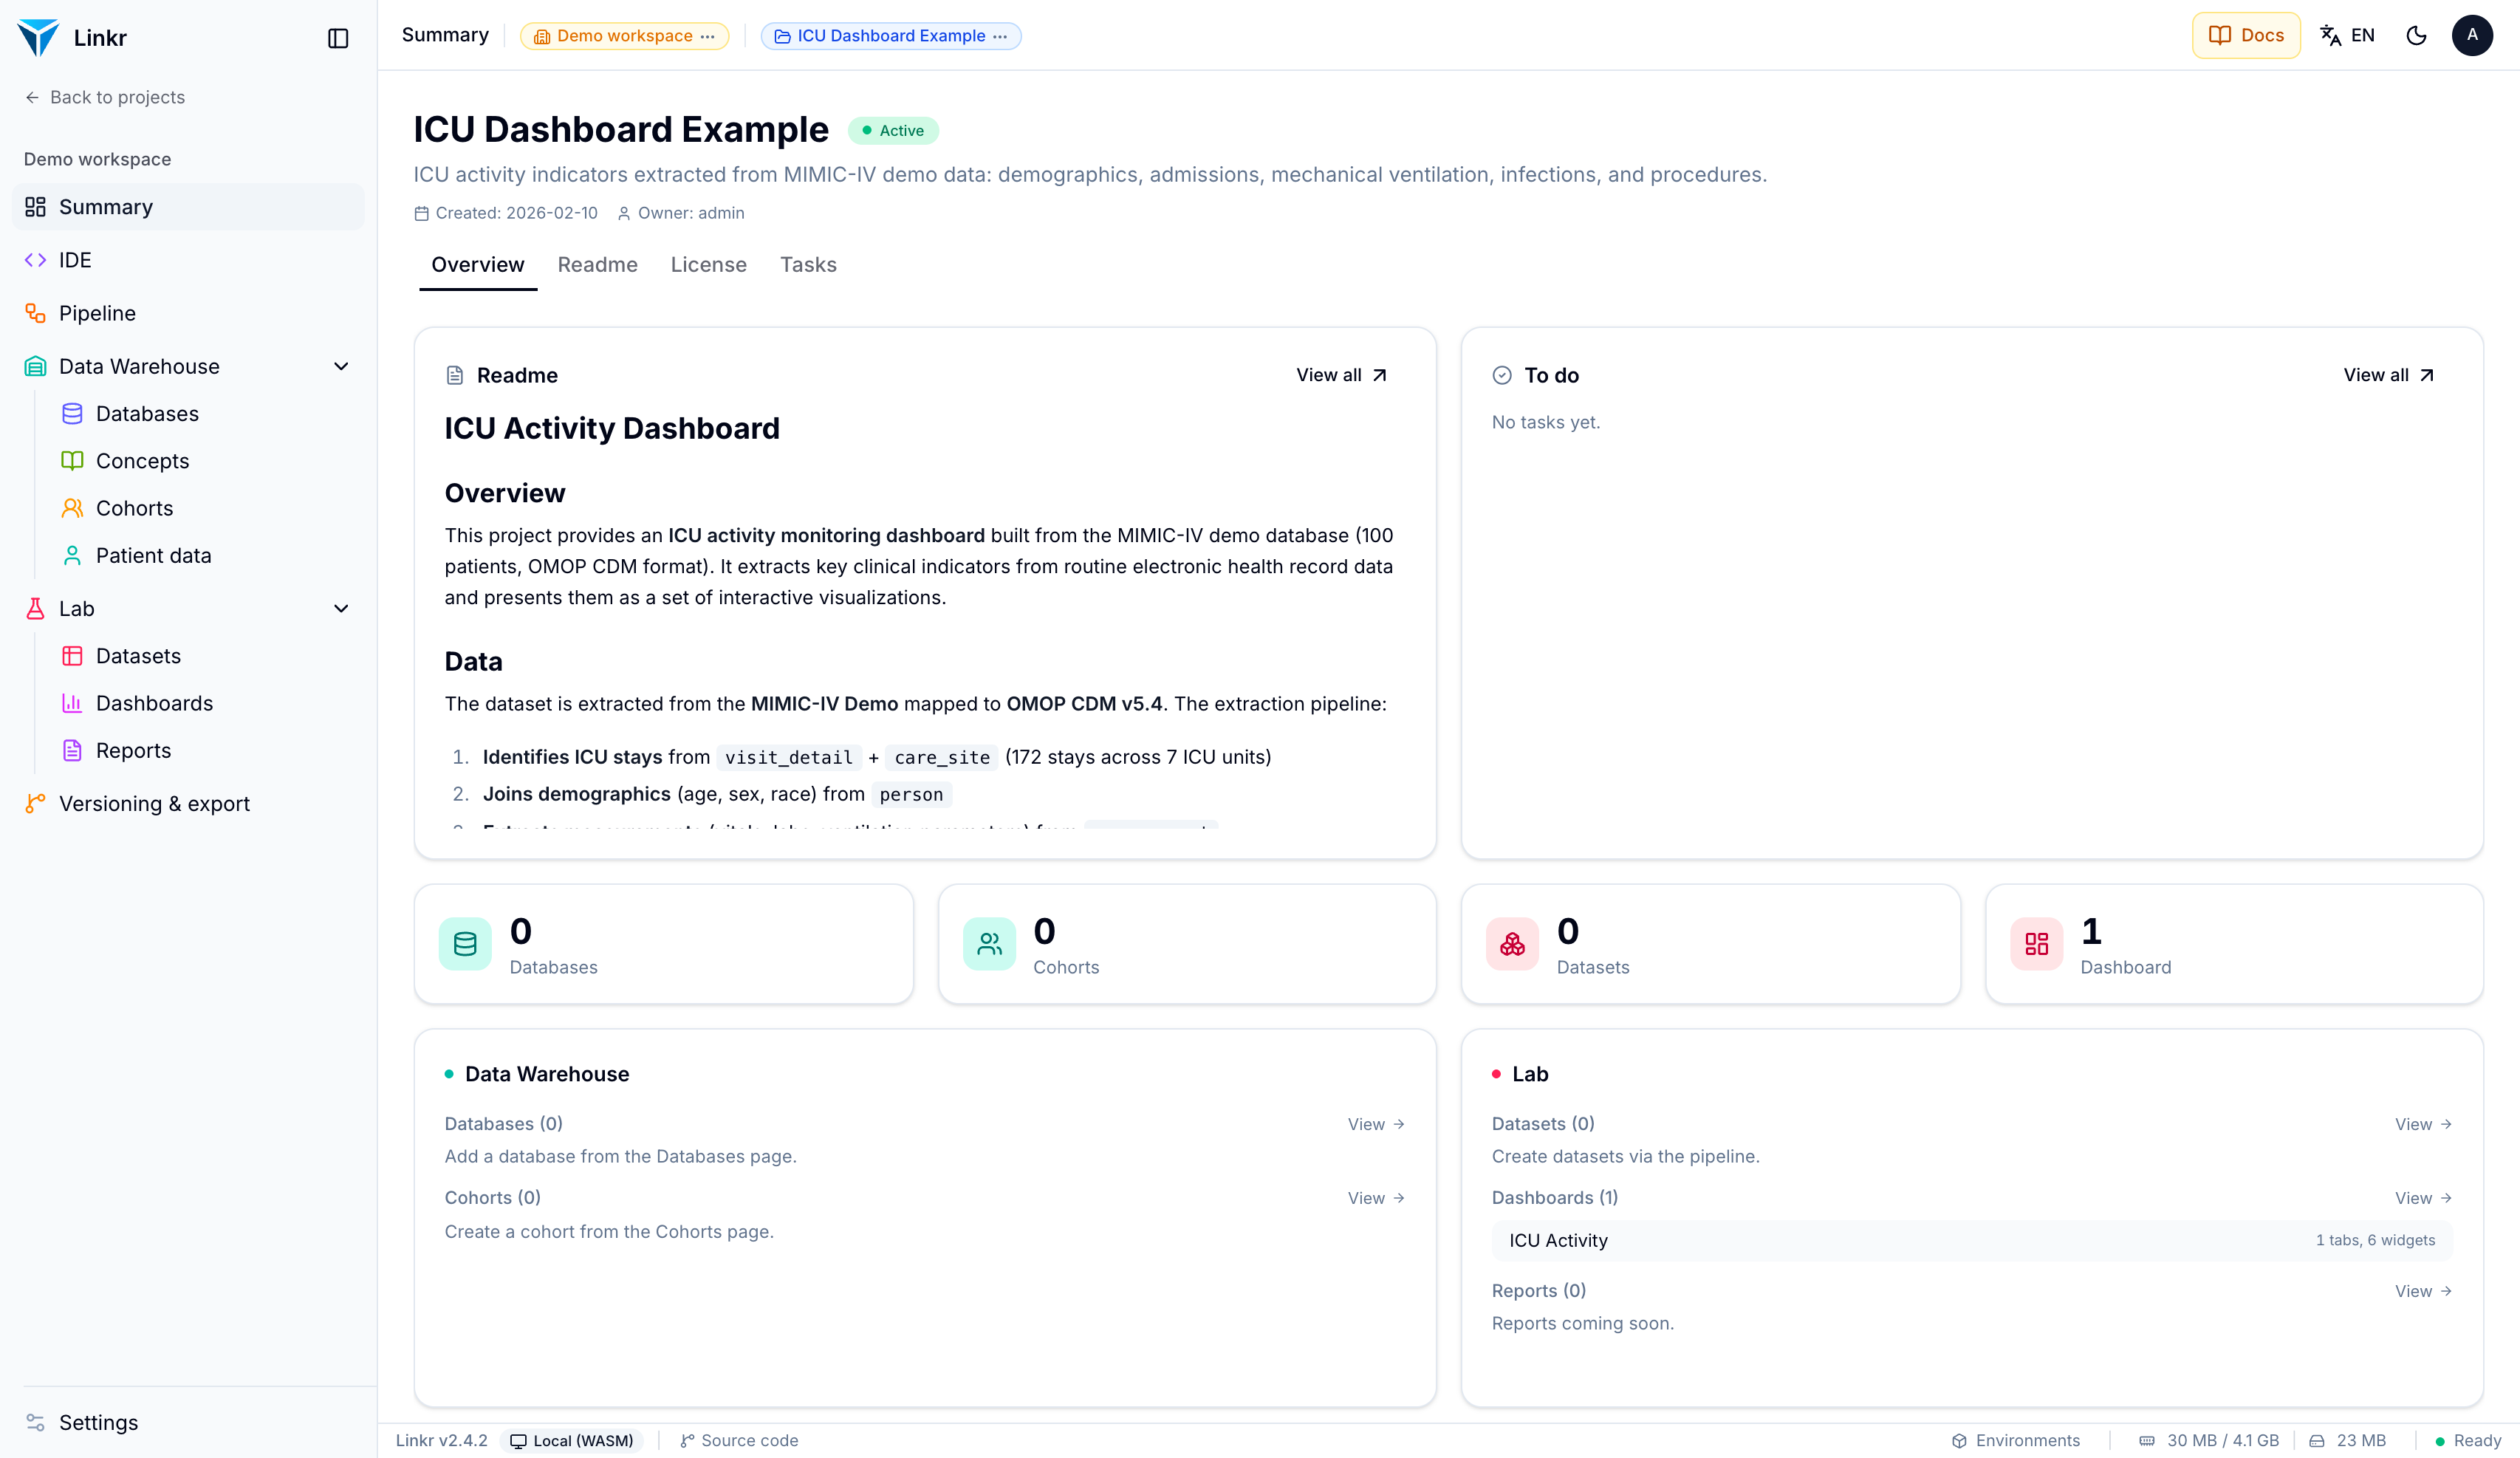
Each entry is detailed in Project overview.
Where is your data stored?
In your browser, in a built-in database called IndexedDB, specific to each site and each browser profile. Nothing is sent to a server. In exchange, clearing site data wipes your work: use a project’s ZIP export (Versioning and export) to keep it.
On an instance installed with its backend, it is the other way round: you log in with an account, and everything is stored on the server. See Deployment modes.
Troubleshooting
The page stays blank or freezes. Reload it. On first load, the browser downloads the DuckDB-WASM SQL engine (~10 MB); Pyodide (~15 MB) and webR (~20 MB) follow the first time you use Python or R. They are cached afterwards.
I can’t find my project any more. Data is specific to each browser and each profile: if you switched browser or profile, or cleared site data, it is not visible. ZIP export is how you carry it around.
Next steps
- Your first project — a guided tour: database, concepts, cohort, dataset, dashboard.
- Local install — run Linkr on your machine.