In short
The Survey question widget analyses one question at a time from an eCRF or survey export: how many people answered it, how the answers break down, and the chart that fits that kind of question. It reads answers already collected — it is not a tool for collecting them.
One question at a time, deliberately
A questionnaire is not an ordinary table. Its unit is not the column but the question — and a multiple-choice question physically occupies several columns, one per option.
More importantly, the number that matters first is not the mean: it is the response rate, and it is computed question by question. “38 respondents out of 42” cannot be derived from the number of rows in the file.
This widget is not a data-entry form
It analyses answers already collected. To collect data by hand — a variable that appears in no table and has to be read from a report — you want the collection panel of a patient board: see Patient data.
Importing the answers
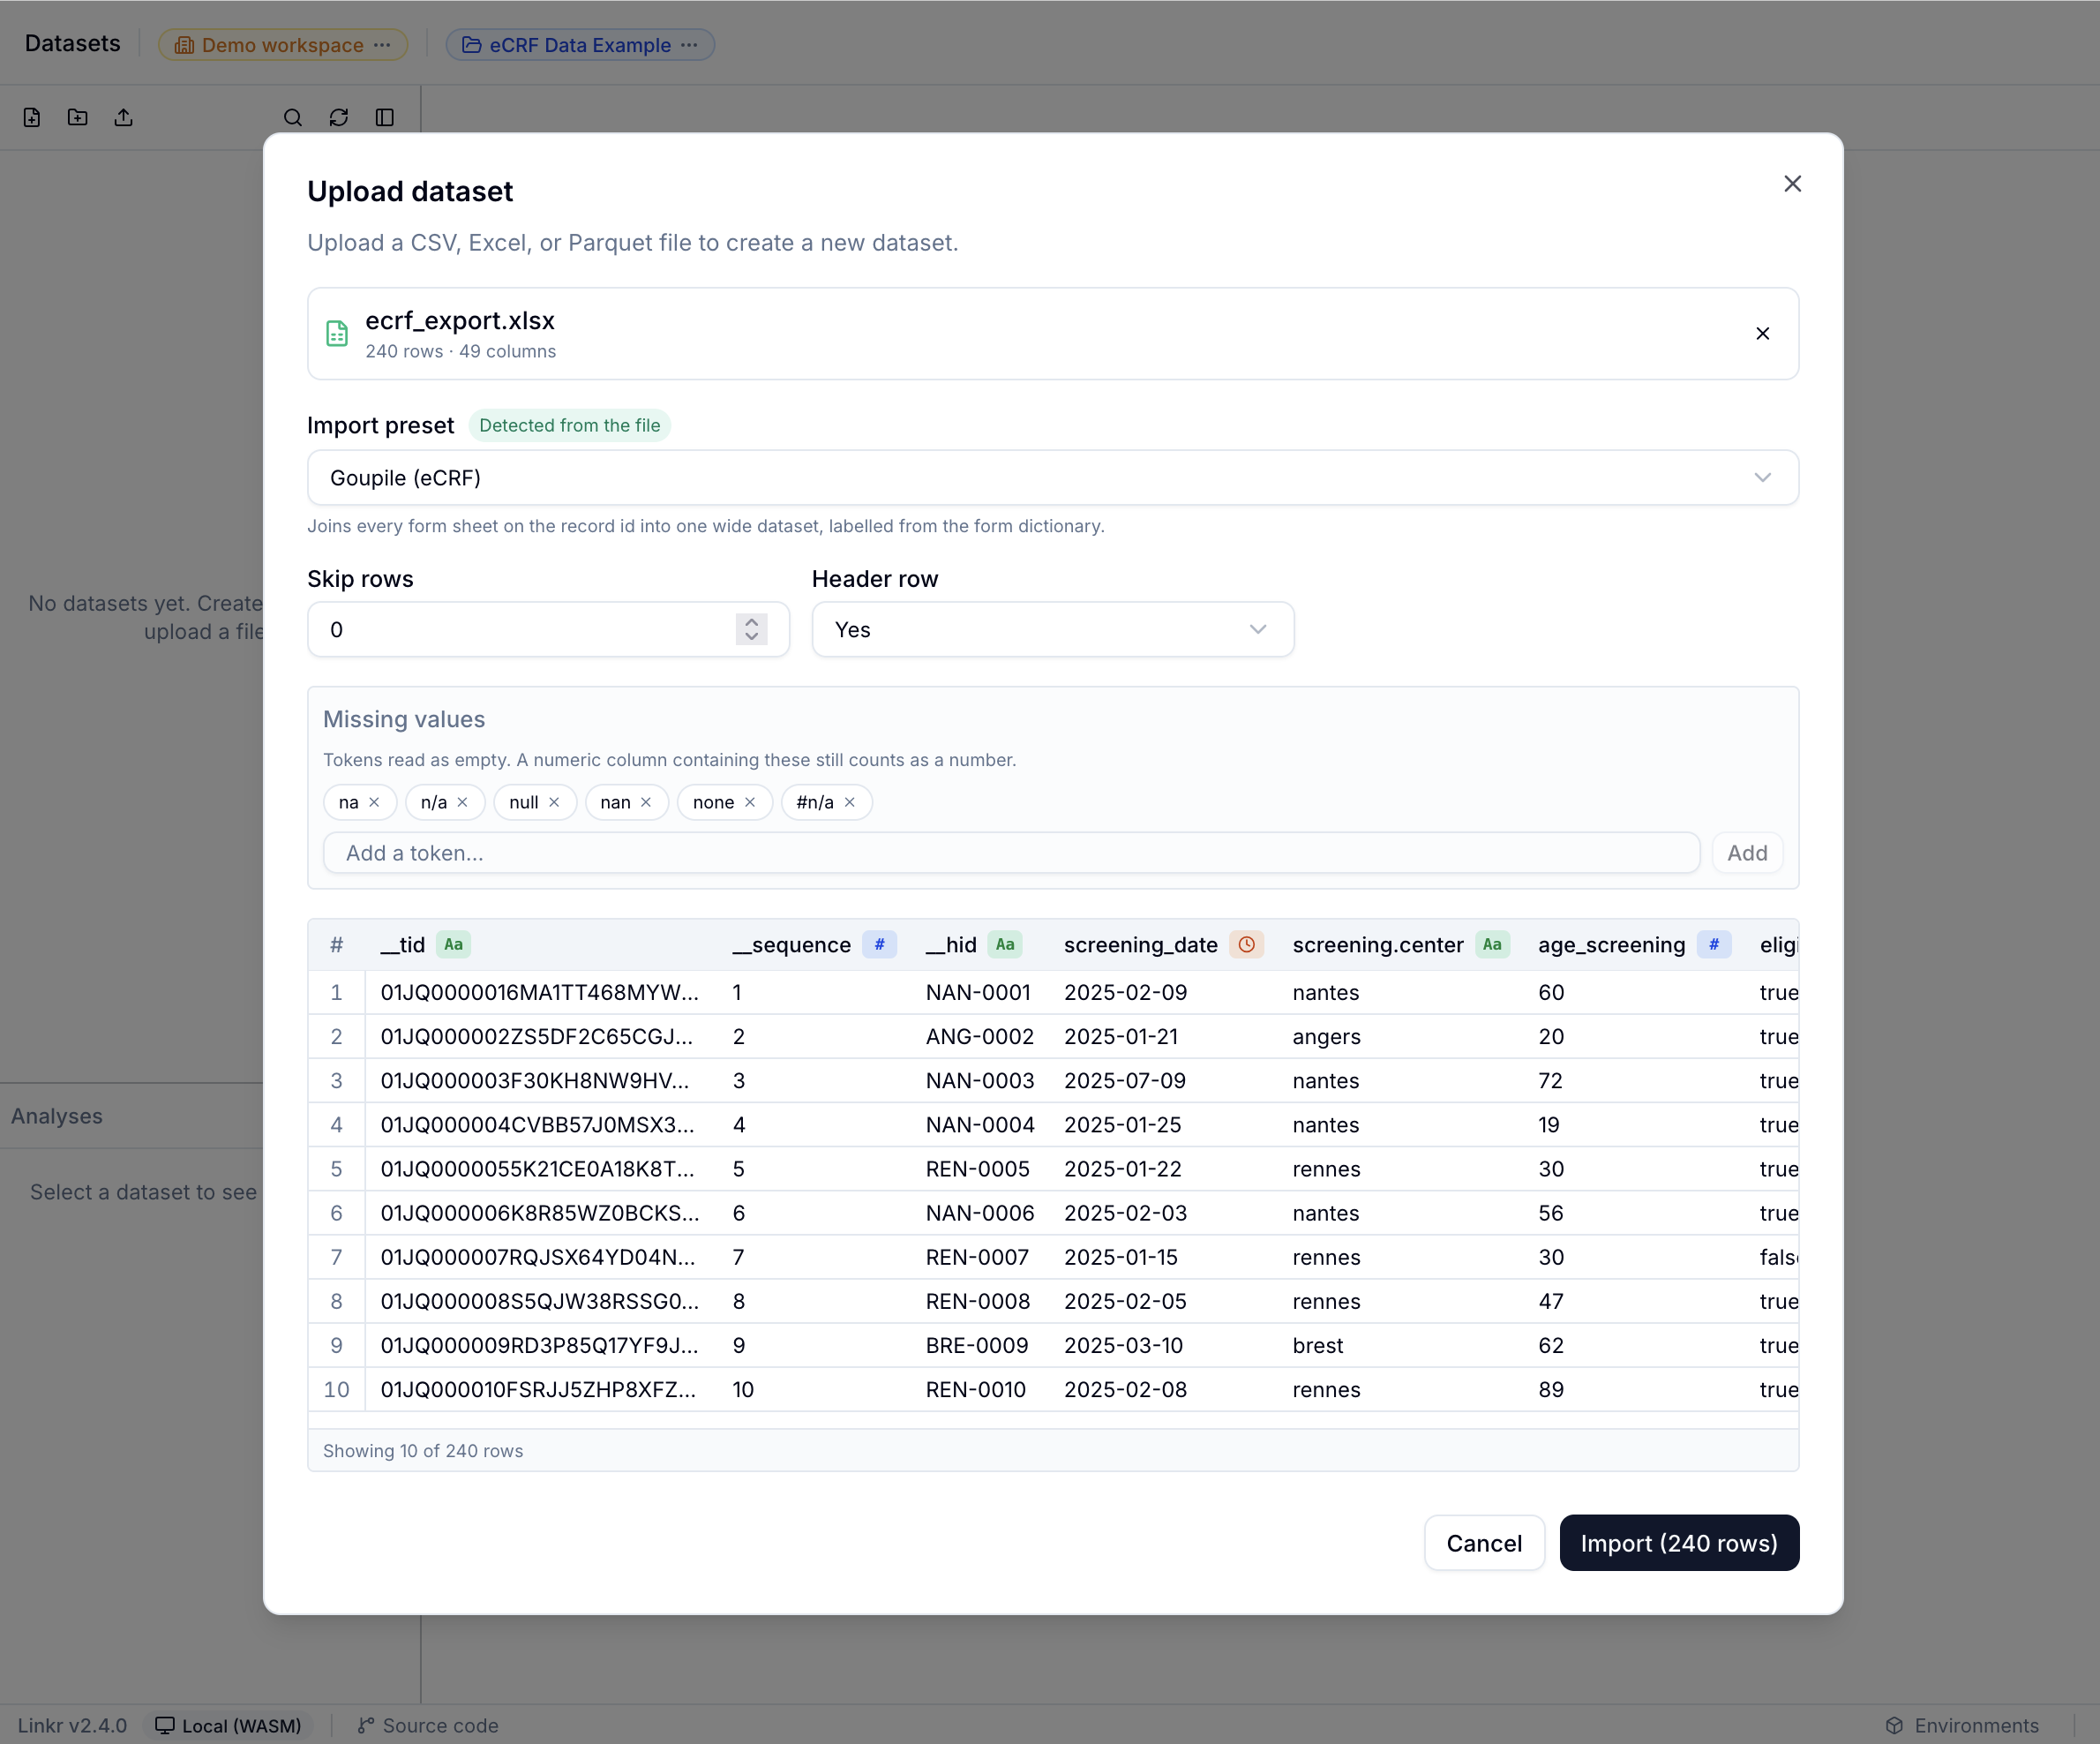
Answers arrive as an ordinary dataset. The import window offers a preset saying how to read the file.
| Preset | What it does |
|---|---|
| Plain table | One row per record, one column per field. No questionnaire structure. |
| Goupile (eCRF) | Joins every form sheet on the record id into one wide dataset, labelled from the form dictionary. |
The preset is preselected from the file, never imposed: you confirm it, or pick another.
REDCap and XLSForm appear in the list but are not wired up yet
The preset menu also offers REDCap and XLSForm / ODK. Reading them is written and tested, but not yet connected to the import: today only Goupile actually parses the file.
In the meantime a REDCap or ODK export imports as a Plain table: the charts work, but question labels and choice lists are not taken from the dictionary.
There is no questionnaire editor in Linkr
The questionnaire’s structure always comes from outside — from the tool you designed it in. Linkr does not create questions, does not set their order, and does not apply display conditions.
Choosing the question
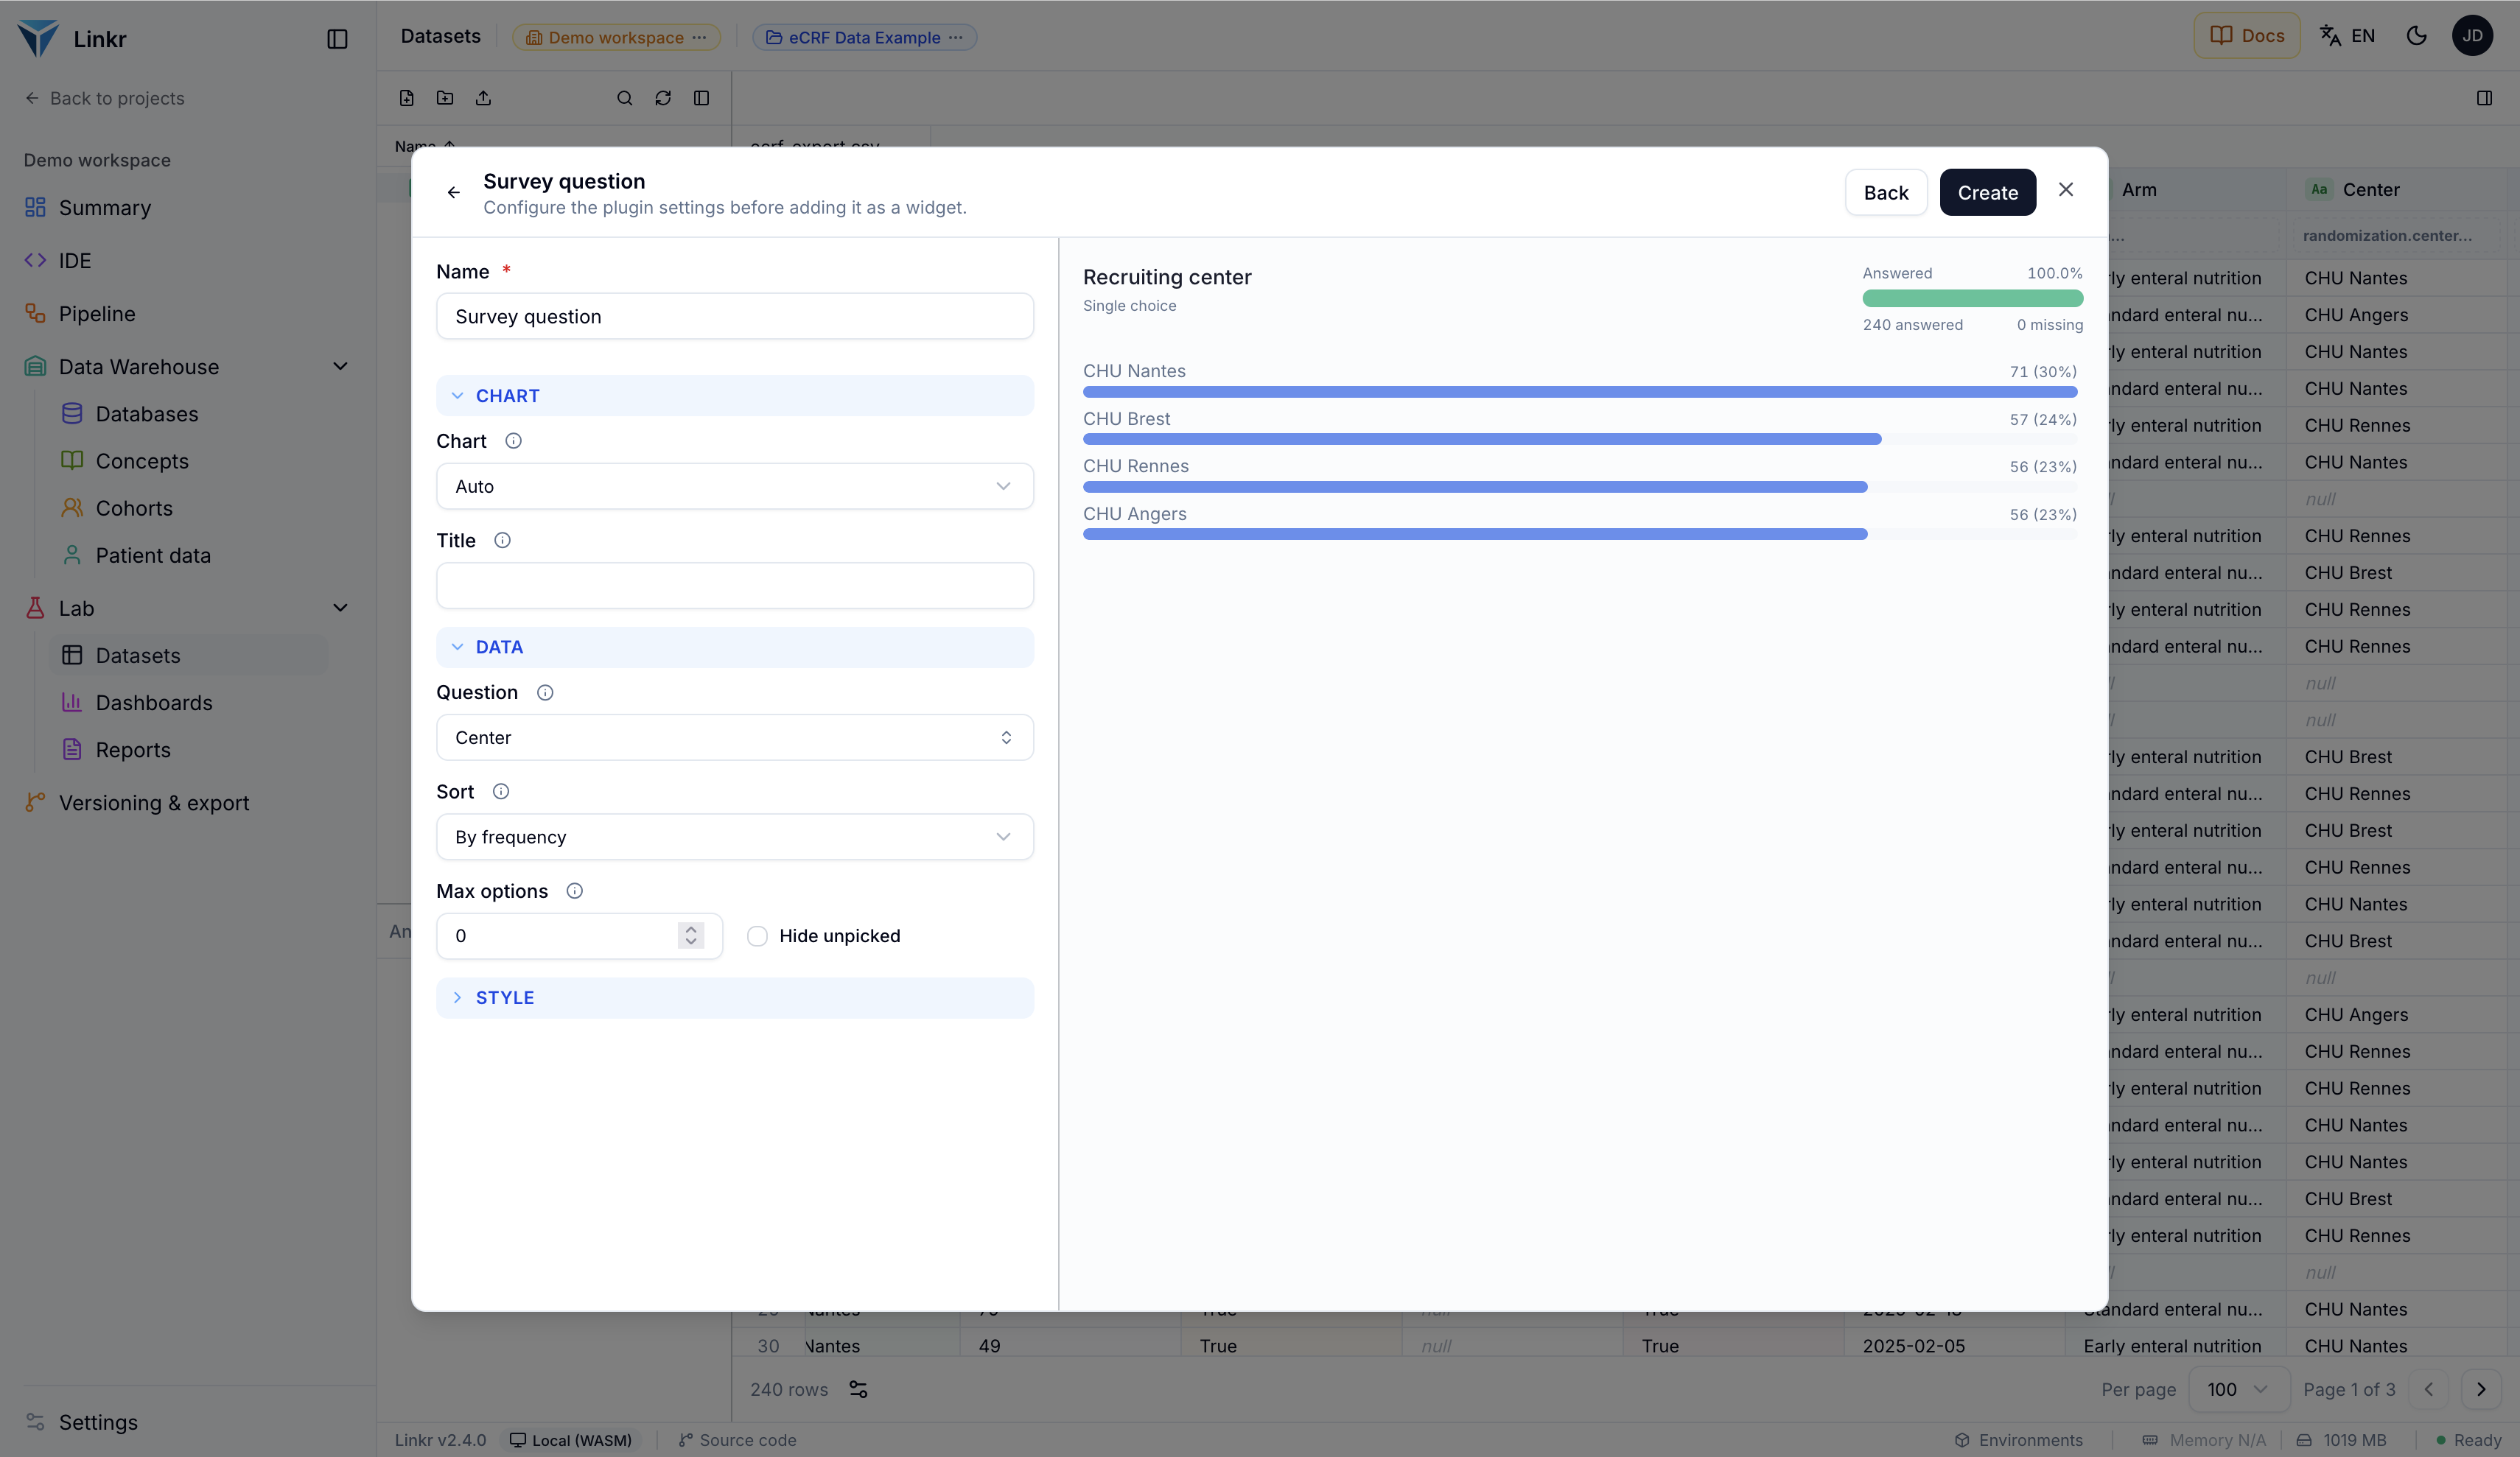
The widget is configured like the others. The Question field accepts any column of the question: for a multiple-choice question, picking one of its options selects the whole question.
The structure is inferred from the file — labels, question type, options. Six types are recognised:
Single choice
One answer among several. A yes/no is one of these.
Multiple choice
Several answers allowed, one column per option.
Scale
A single choice whose order carries meaning, and must be kept.
Numeric
A number: age, duration, score.
Date
A date, with or without a time.
Free text
A written answer, tallied like choices.
The chart follows the question type
The Chart setting only offers what makes sense for the question you picked.
| Question type | Charts offered |
|---|---|
| Single choice, scale | Horizontal bars, vertical bars, pie, donut, table. |
| Multiple choice | Horizontal bars, vertical bars, table. Neither pie nor donut. |
| Numeric | Histogram, summary statistics. |
| Free text | Answer list, bars, table. |
How did you travel to the hospital?
Single choice
Why no pie chart for a multiple-choice question
A pie chart asserts that its slices make up a whole. When everyone may tick several answers, the total exceeds 100%: the chart would misrepresent the data. The widget therefore does not offer it, and notes under the question that percentages are over respondents — with the average number of answers per person.
The order of answers
Sorting is adjustable: by frequency, in questionnaire order, alphabetical, or custom — answers are then dragged into the order you want.
For a scale, order is not decorative
“Never, sometimes, often, always” sorted by frequency becomes unreadable: you lose the progression that gives the scale its meaning. Keep the questionnaire order.
Reading a response rate
To the right of the question, an Answered bar gives the response rate — answers in green, missing in red —, with both counts underneath: 38 answered, 4 missing. The denominator deserves attention.
A conditional question does not have the same denominator
If a question was only asked of some respondents — because it depended on an earlier answer — the widget says so: the denominator is that subgroup, not the total. Without that note, a low response rate would wrongly read as poor completion.
Linkr shows the warning when the file allows it, but does not evaluate the original questionnaire’s display conditions.
Where to find the widget
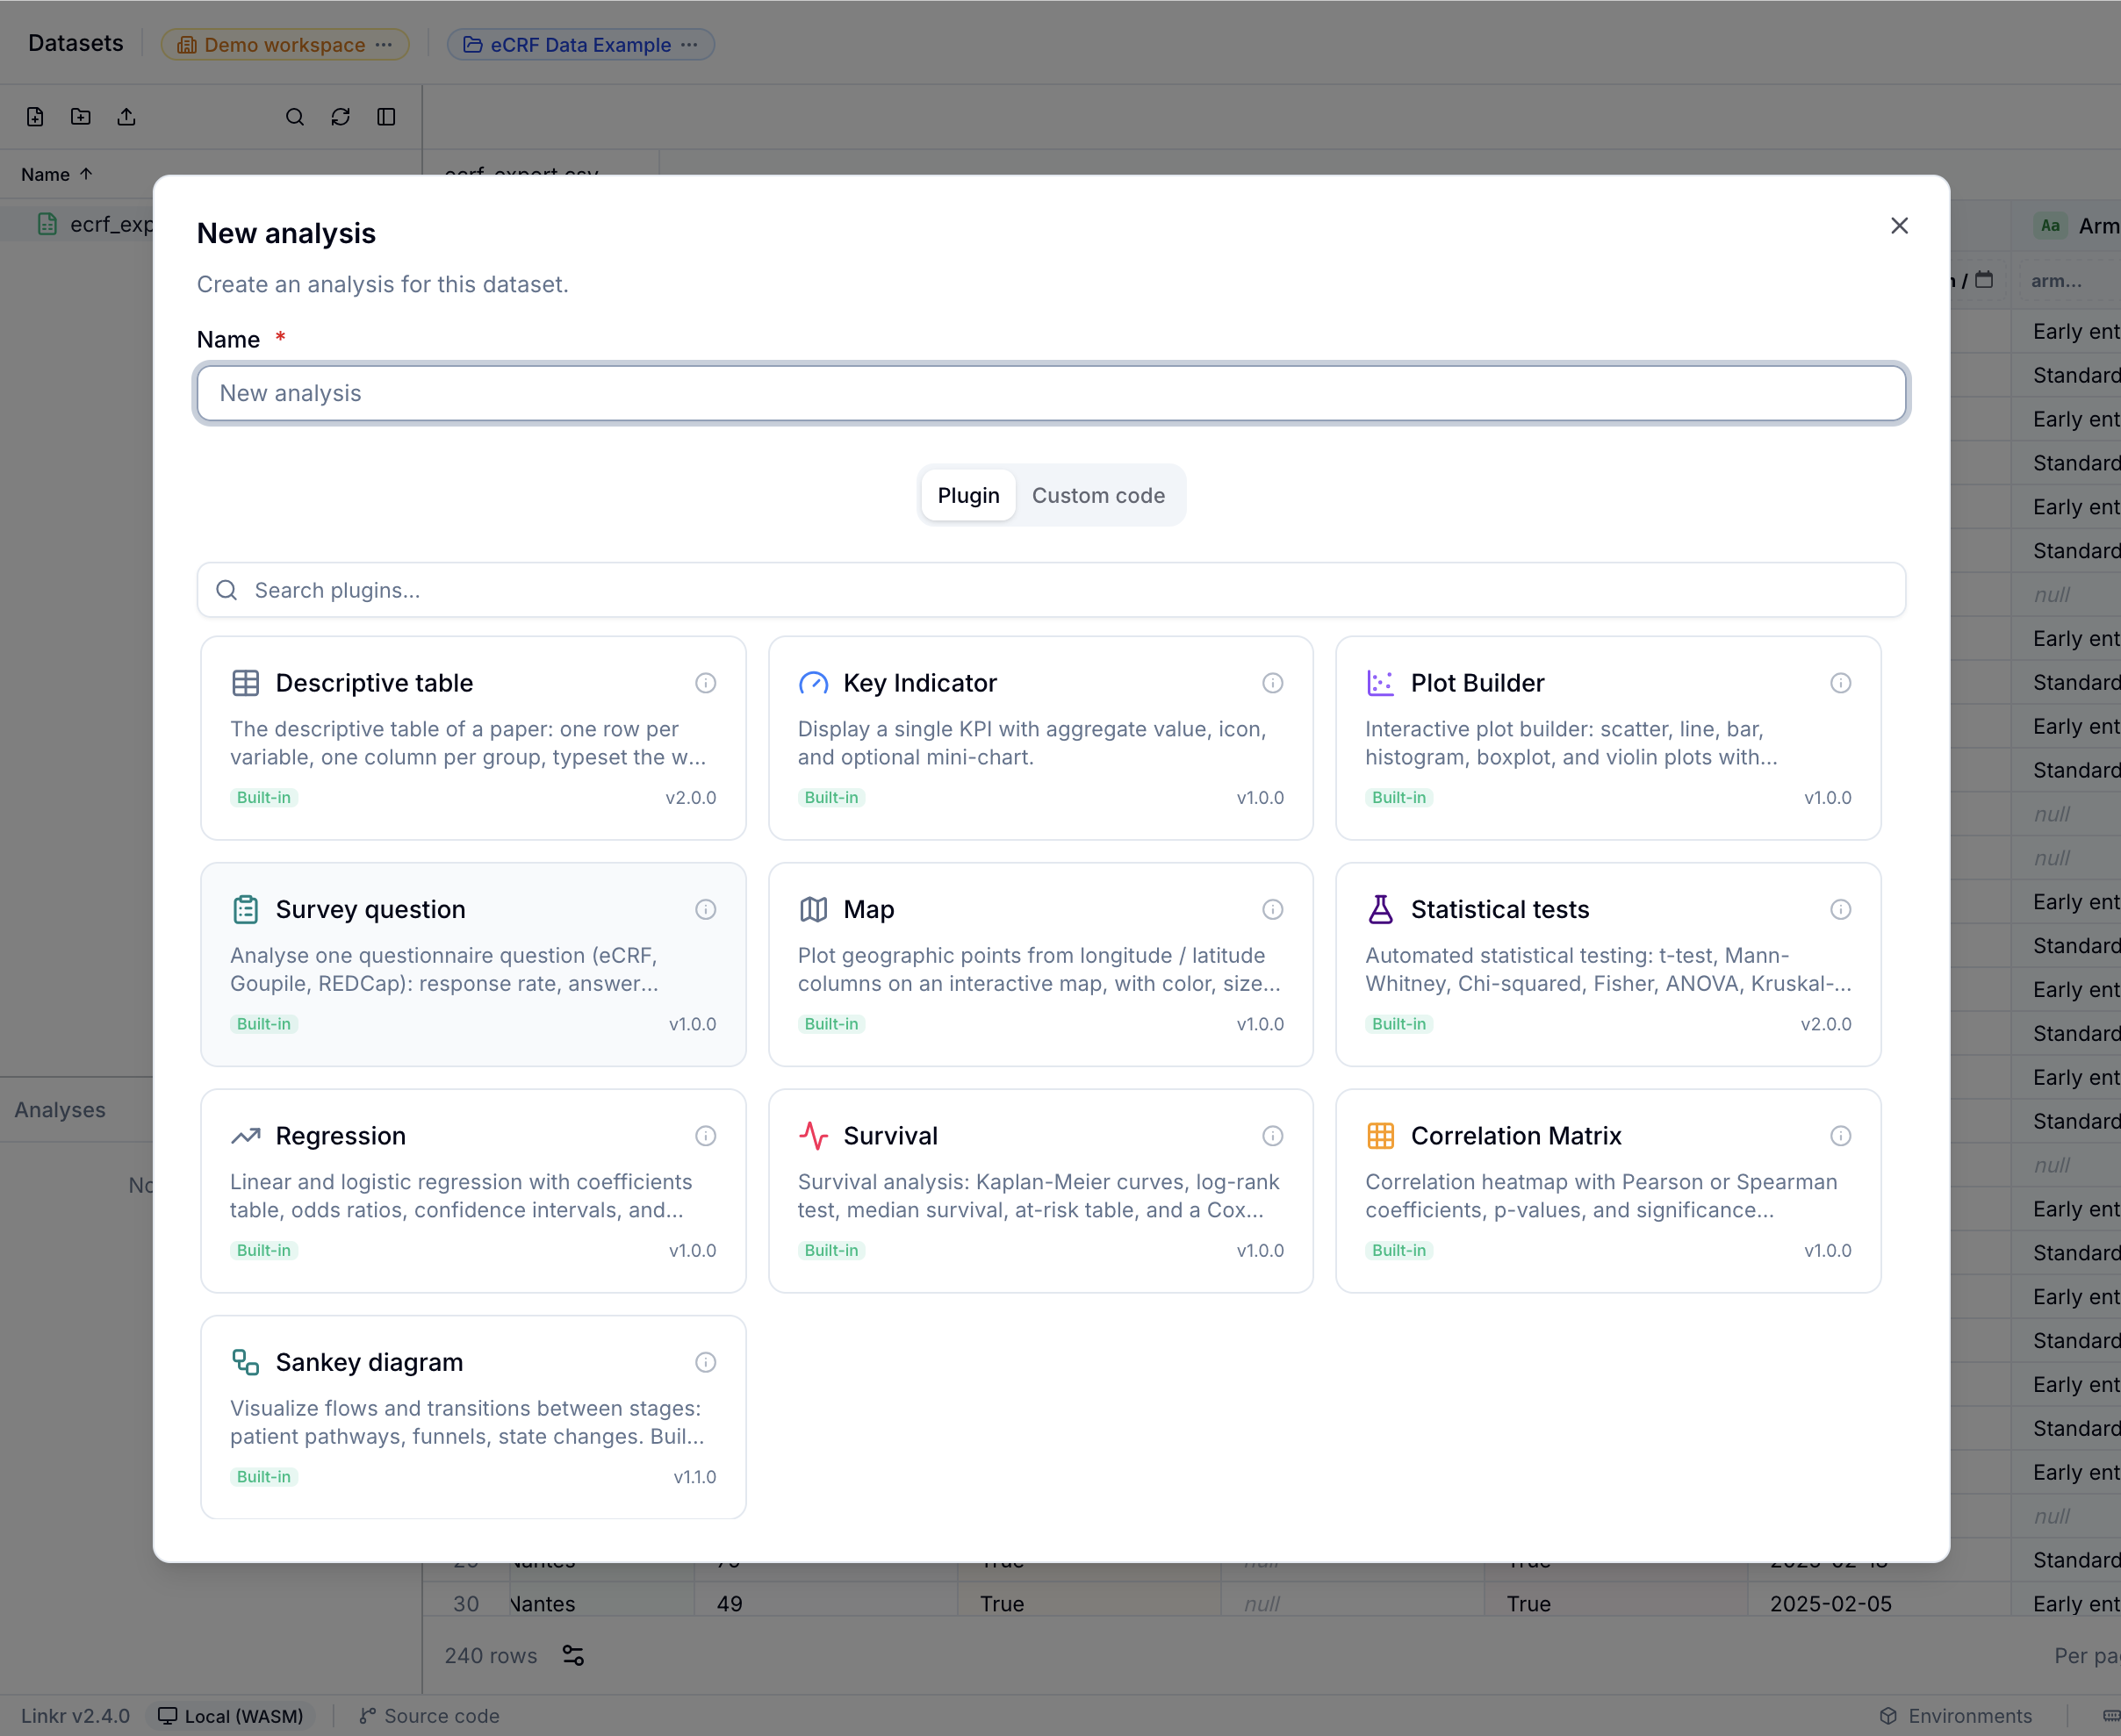
It is added like the others, from the list of analyses on a dataset or a dashboard.
Still to come
- Wiring REDCap and XLSForm into the import, to pick up their question dictionaries.
- Storing the inferred structure with the dataset, rather than re-deriving it on every render.
- Correcting a question’s type when inference gets it wrong — there is no setting for that today.
- Other export formats — LimeSurvey, Castor, OpenClinica — are under consideration, with no timeline.
Going further
- Patient data — manual collection, for producing data rather than analysing it.
- Analysis widgets — statistical analyses on a dataset.
- Datasets — importing and correcting a questionnaire export.
- Tabs and widgets — placing this widget in a dashboard.