Summary
The Lab is a project's analysis space. It starts from a dataset in wide format — one row per stay, one column per variable — onto which you attach analyses configured without writing code (descriptive table, regression), plus an IDE for R and Python for anything that needs to be bespoke.
This page continues the journey from the data warehouse: the warehouse is for exploring and selecting, the Lab for analysing. The data is still the MIMIC-IV Demo.
Datasets
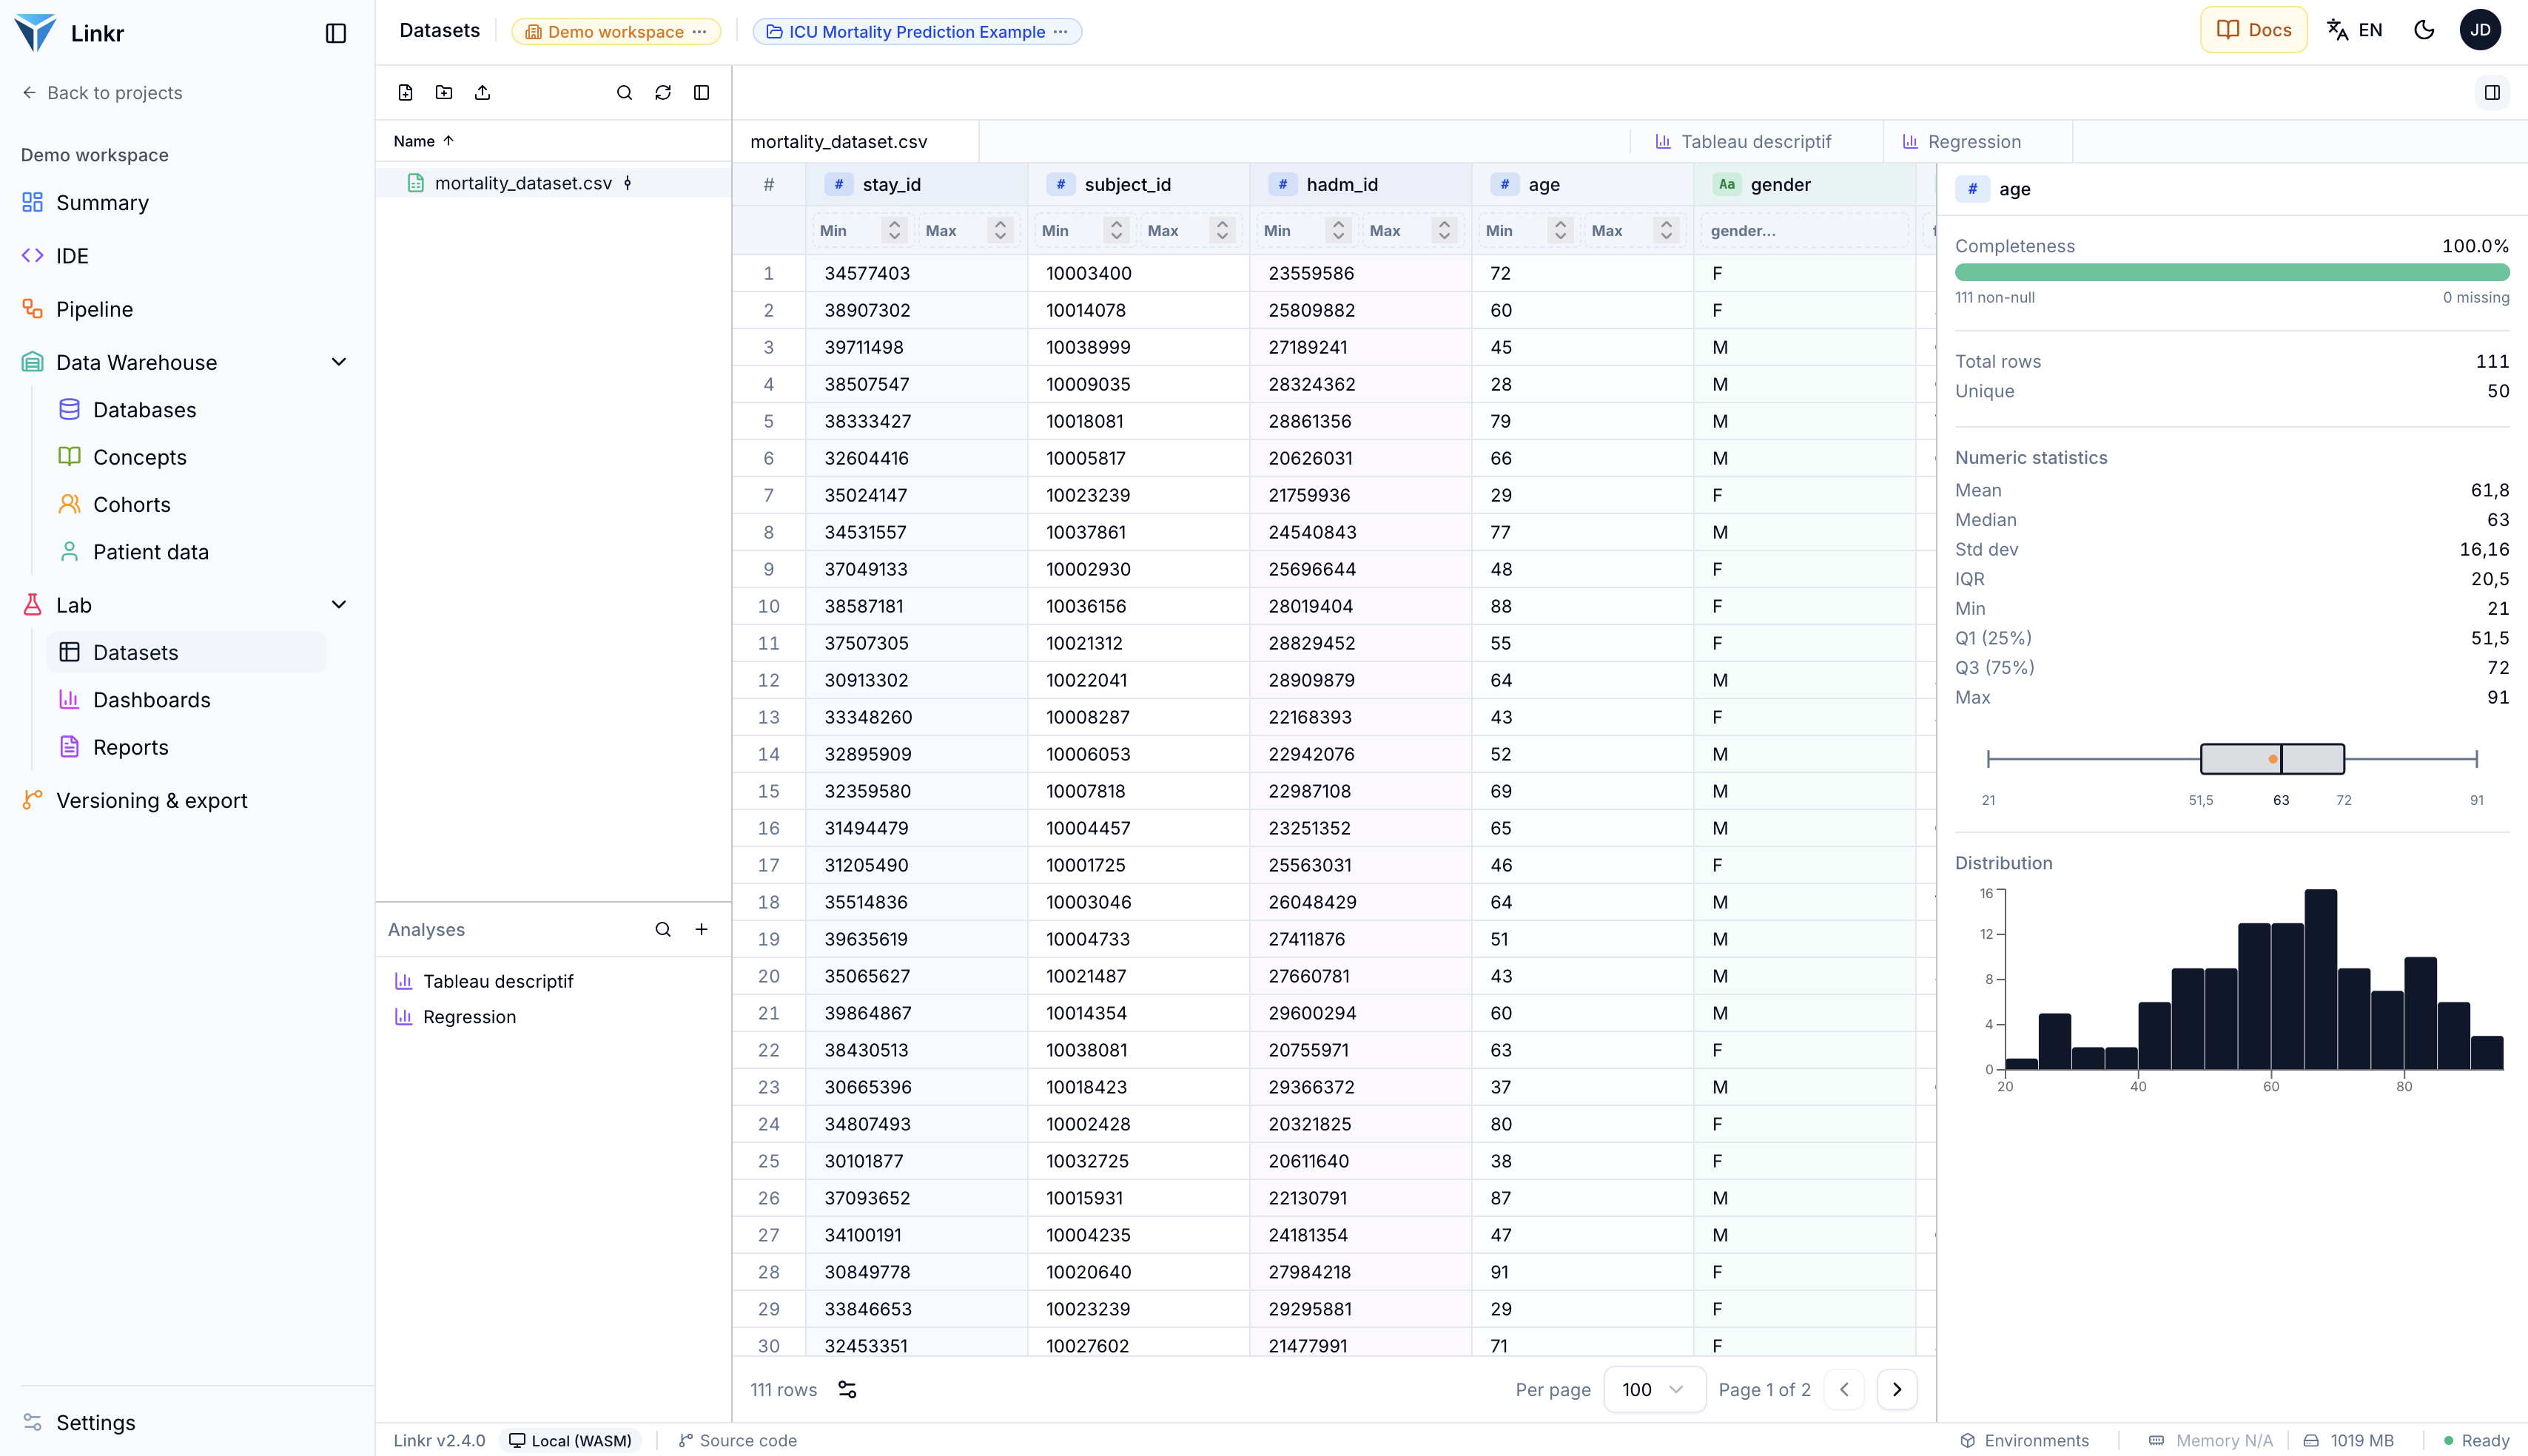
A dataset is a table in wide format: one row per stay, one column per variable. This is the shape nearly every statistical tool expects — and the opposite of the warehouse's long format, where each measurement takes up its own row. The article Organising your data covers both shapes and how to move between them.
The demo dataset holds 111 stays and 21 variables: age, sex, admission unit,
length of stay, then the lab extrema of the first 24 hours (lactate, creatinine, bicarbonate,
Glasgow coma score…) and the variable to predict, in_hospital_death.
Selecting a column shows its completeness, statistics and distribution in the right-hand panel — mean, median, quartiles, box plot and histogram. This is the first thing to look at before any analysis: a variable with 39% missing values cannot be treated like a complete one.
Analyses
Below the file list, the Analyses panel gathers the analyses attached to the dataset. The demo has two: a Tableau descriptif (descriptive table) and a Regression. Each one is a form on the left, a result on the right.
![The descriptive table grouped by in_hospital_death: 96 survivors against 15 deaths, each variable summarised as median [IQR] or count (%).](/images/demo/analysis-table1-en.png)
The descriptive table — the Table 1 of every clinical paper — is configured in a few fields: the variables to include, the Group by variable, and the numeric summary (here median [IQR]). Numeric variables are summarised by their median and interquartile range, categorical ones by count and percentage, and missing values get their own row when Missing row is ticked.
The contrast between the two groups can be read directly: patients who died are older (66 versus 61), stay longer (4.9 days versus 2.3) and have higher lactate and creatinine. The Export button produces the table ready for publication.
IDE
Not everything fits in a form. The built-in IDE opens the project's scripts — R Markdown, Jupyter notebooks, SQL, Python, R — and runs them in the browser, with nothing to install.
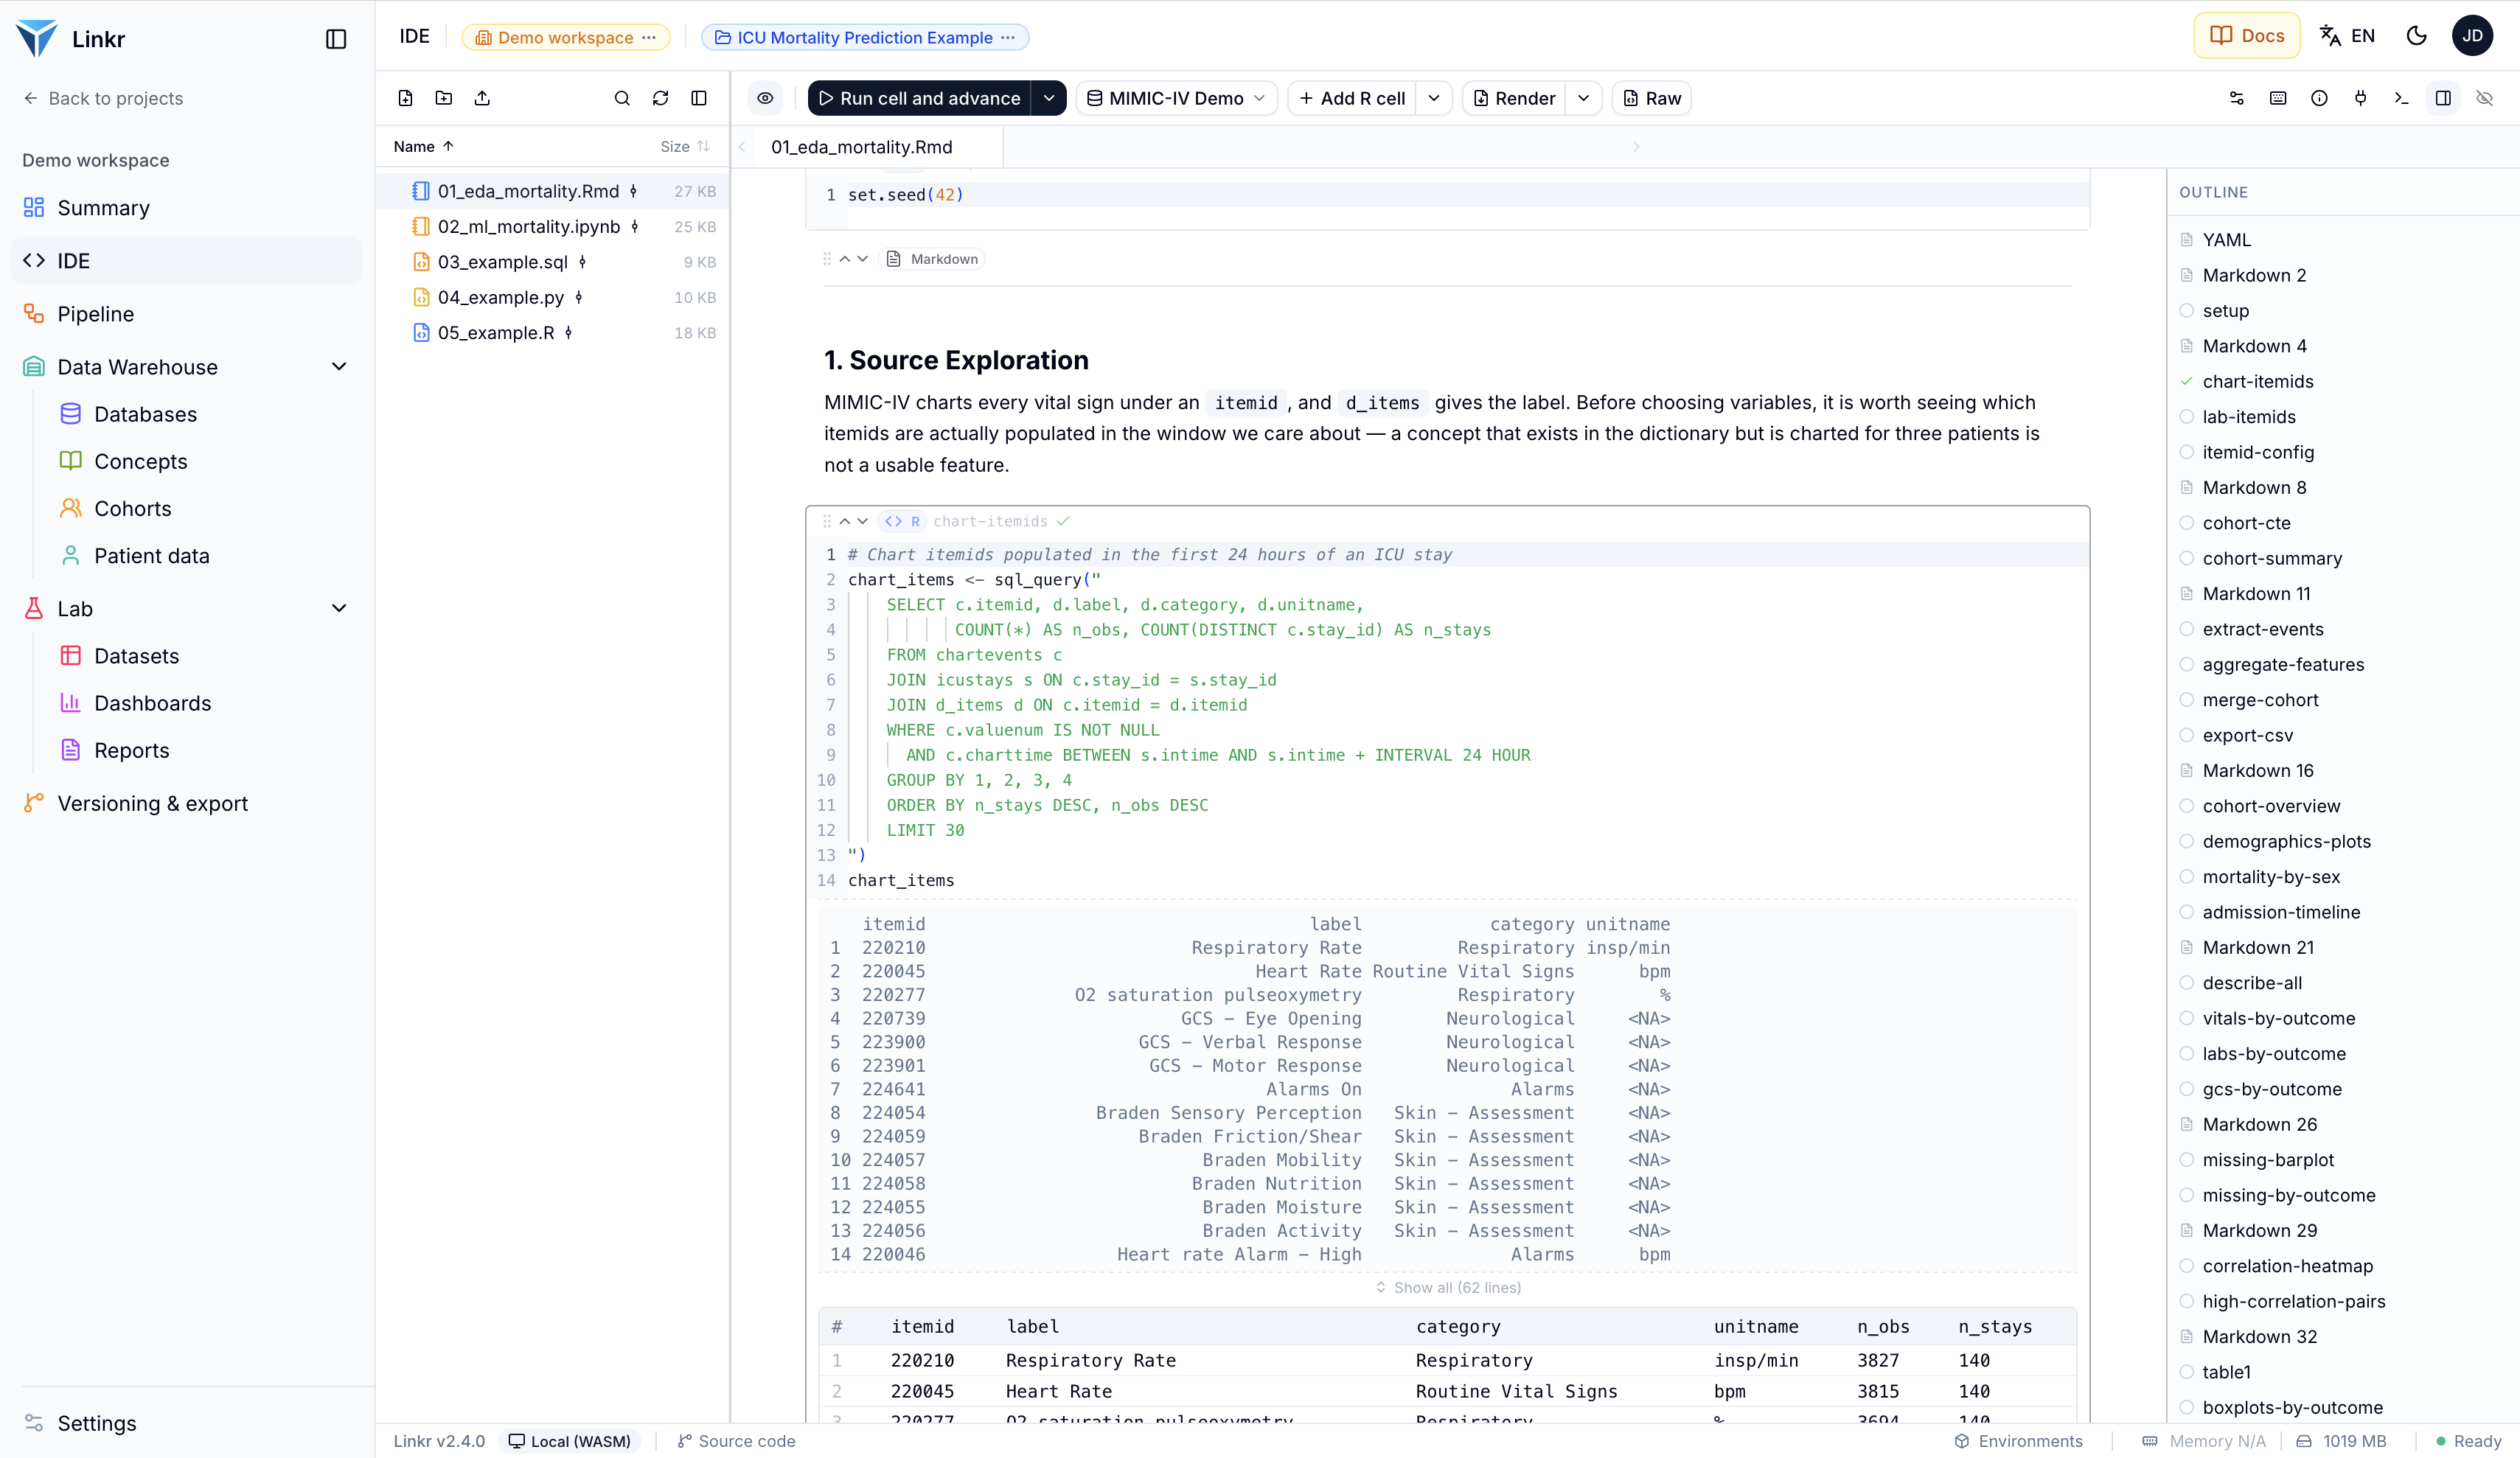
The project ships five scripts, including the exploratory analysis in R Markdown above and a modelling notebook in Python. Cells run one at a time (Run cell and advance), alternating prose, code and results, and the outline on the right makes a long document navigable.
The key point: the dropdown at the top names the database being queried — here MIMIC-IV Demo. So a SQL cell hits the warehouse directly, and its result comes back as a table the following R code can reuse. That chain is what produces the dataset at the top of this page.
Going further
- Explore a health data warehouse — where the data analysed here comes from.
- Long format and wide format — why the warehouse and the Lab do not use the same table shape.
- Deployment modes — what runs in the browser and what needs a server.