Summary
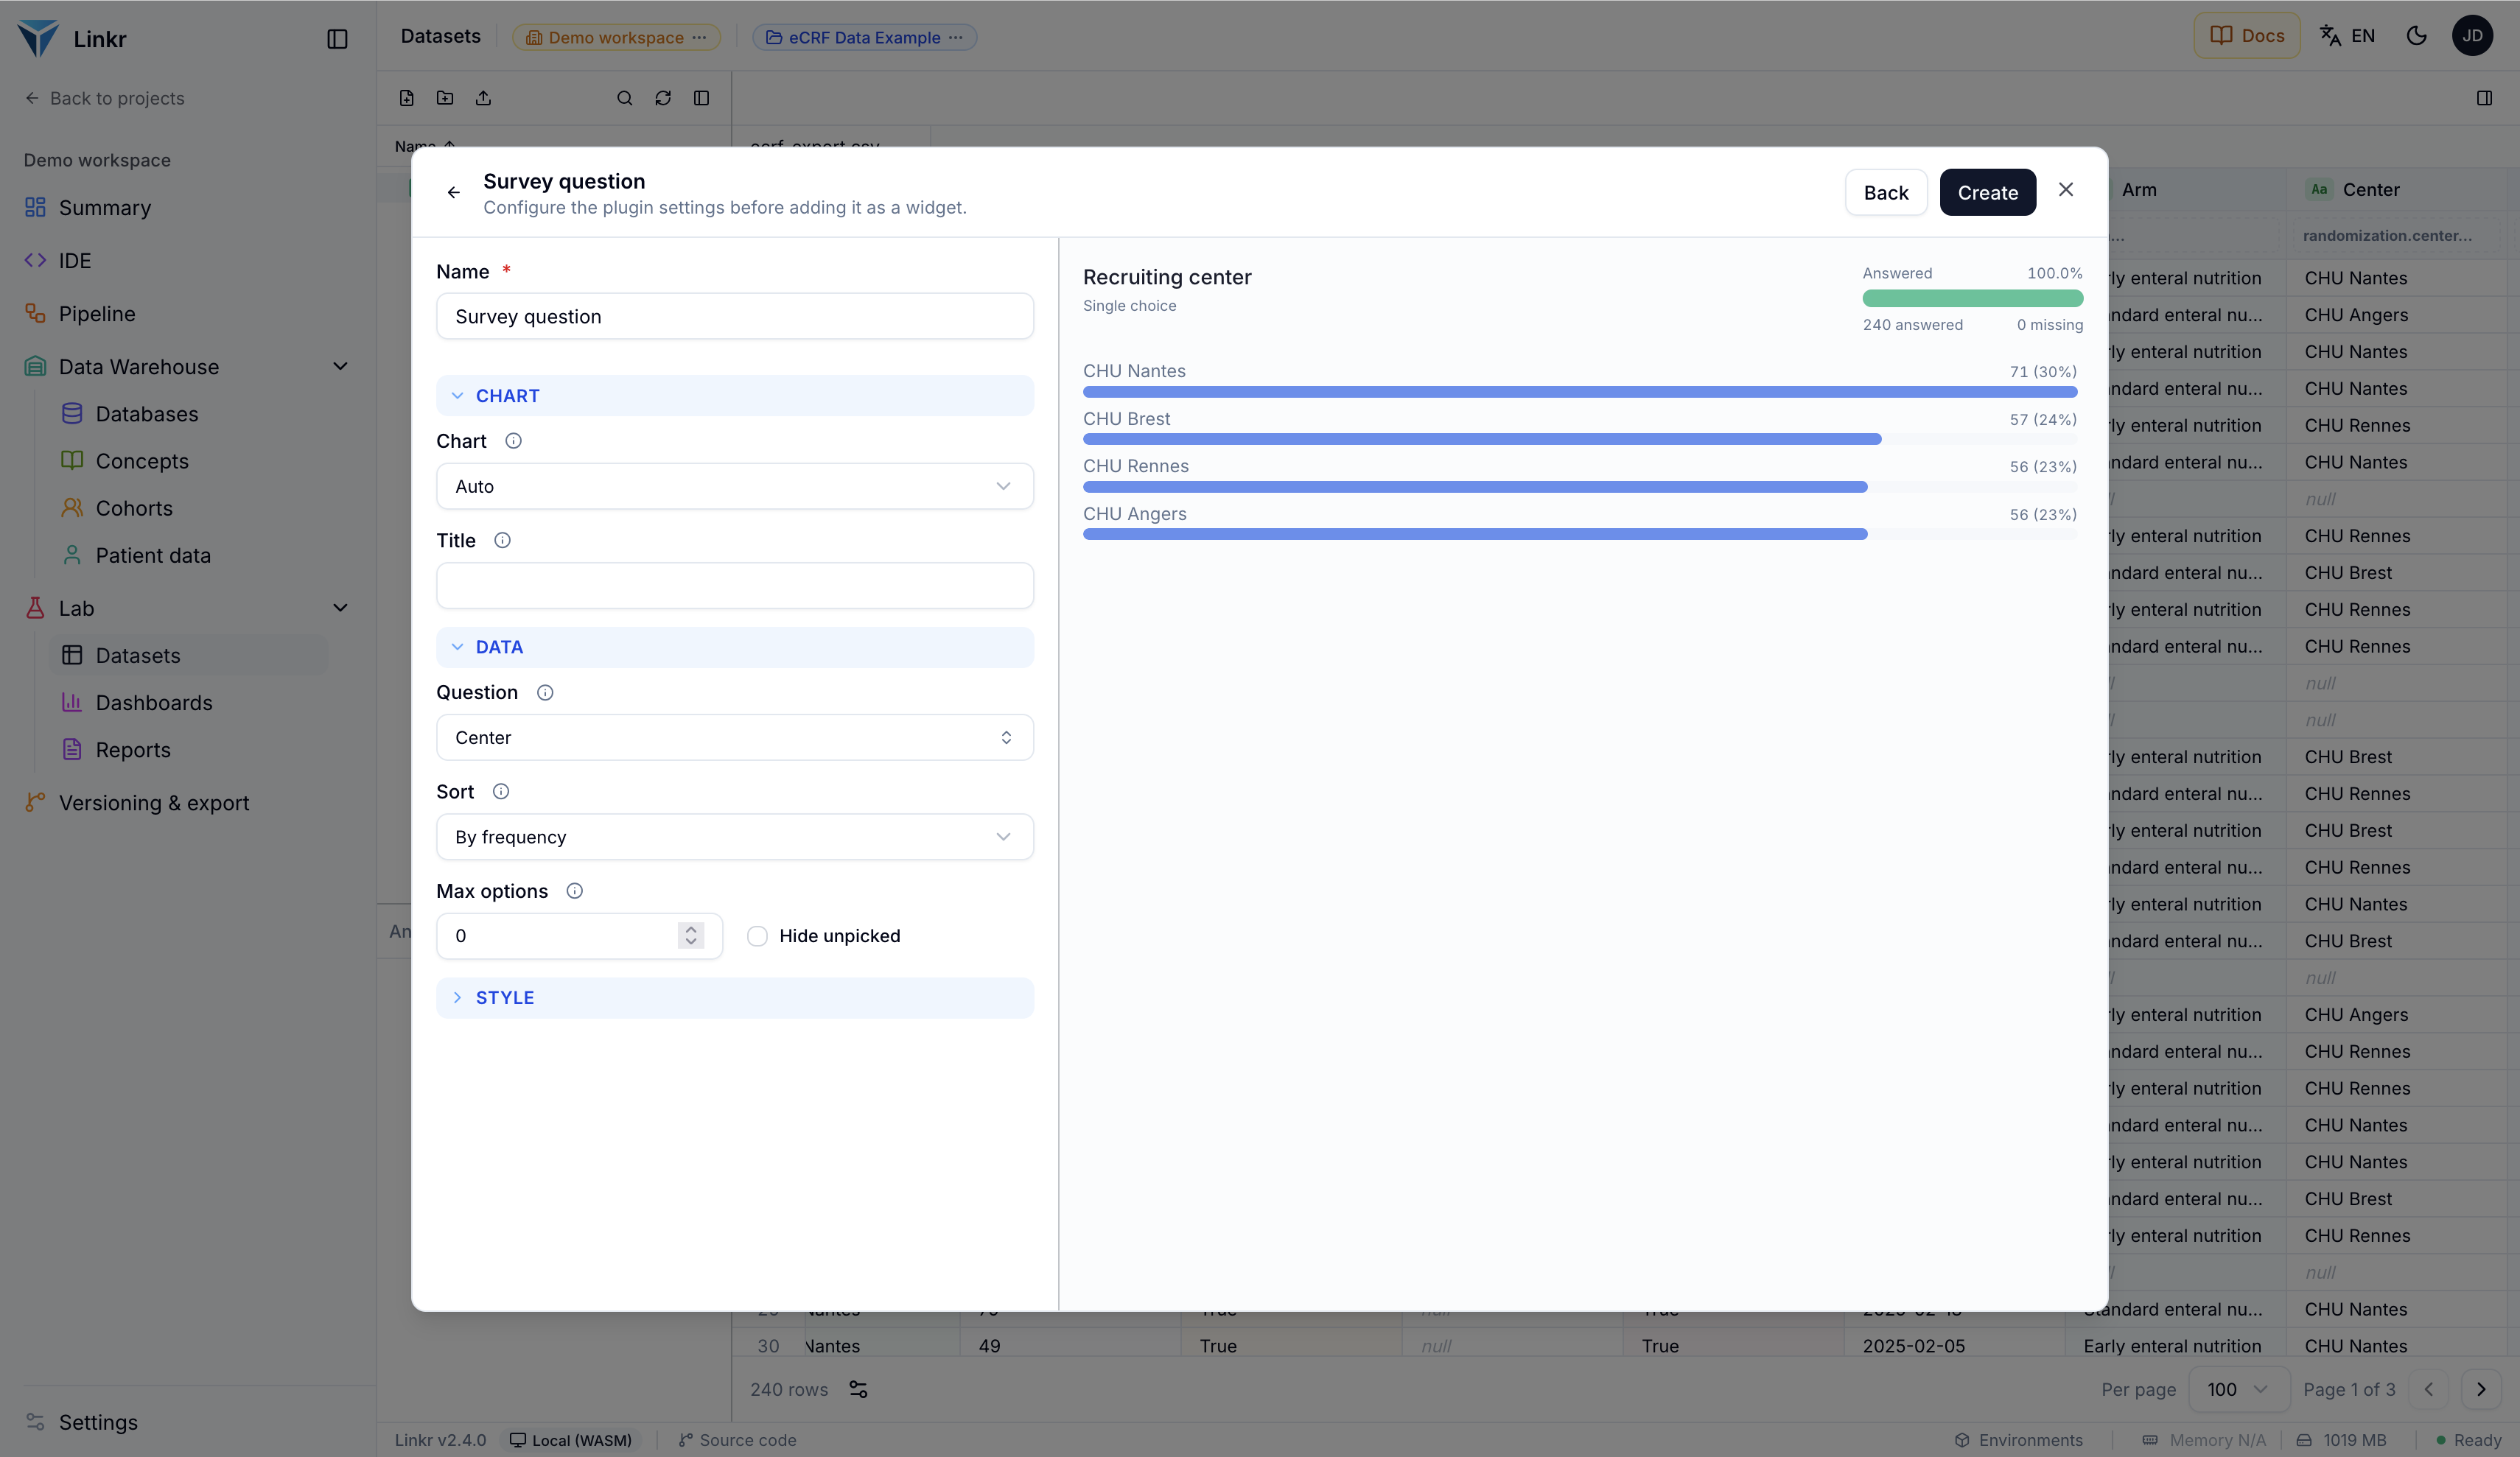
An eCRF export — electronic case report form — imports as it is: Linkr recognises the Goupile or REDCap format, joins the form sheets back together and picks up the labels from the dictionary. The Survey question plugin then analyses each question with its response rate, which is the first thing to check on any collection.
An eCRF is the data collection tool of clinical studies: a structured form, filled in centre by centre. What comes out of it is rarely a clean table — which is usually where the work starts.
Importing an eCRF export
Importing a file opens a dialog that detects the format and offers the matching preset. Here, Goupile (eCRF) — an open-source eCRF developed in France — was recognised from the file.
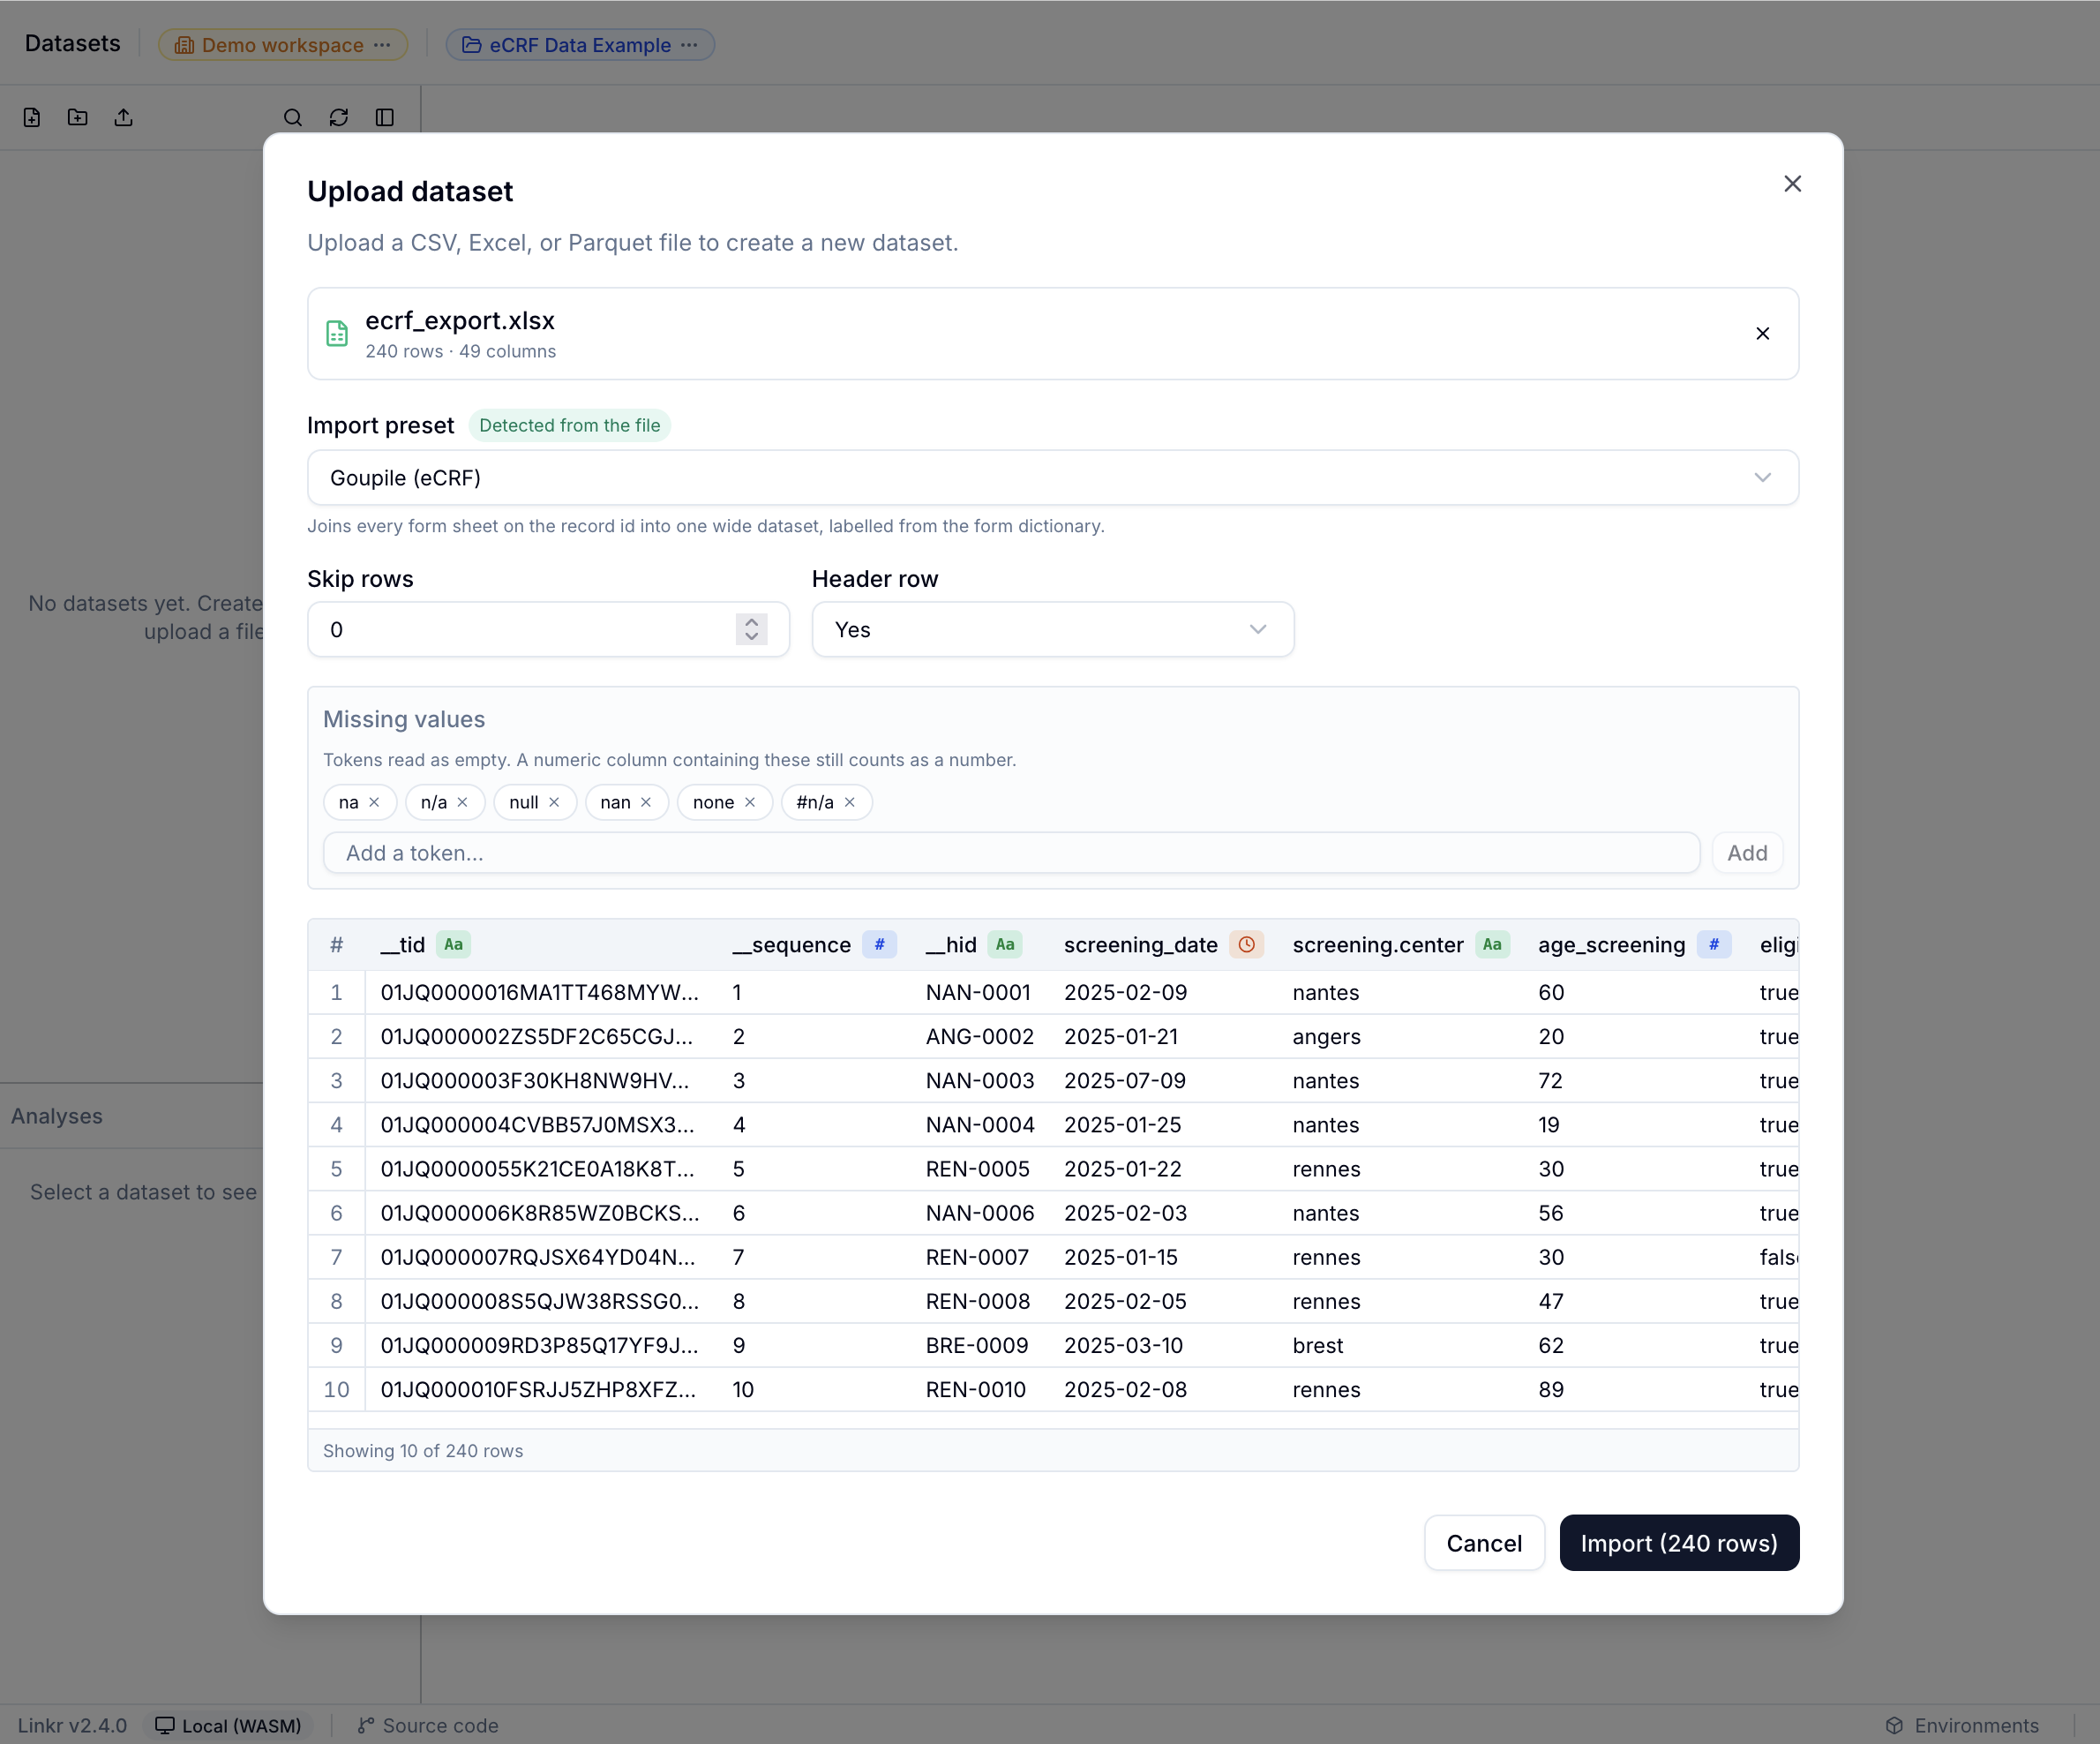
That preset does three things you would otherwise have to code: it joins every form
sheet on the record identifier into a single table, it labels the columns
from the form's dictionary, and it handles missing value tokens
(na, n/a, null…) so a numeric column containing them stays
numeric.
The resulting dataset holds 240 records and 49 columns: investigating centre, screening date, eligibility, allocation arm, and the questionnaire answers.
Analysing the answers
Like any dataset, this one takes analyses. The plugin library is the same as for dashboards — but one of them is built for this exact case.
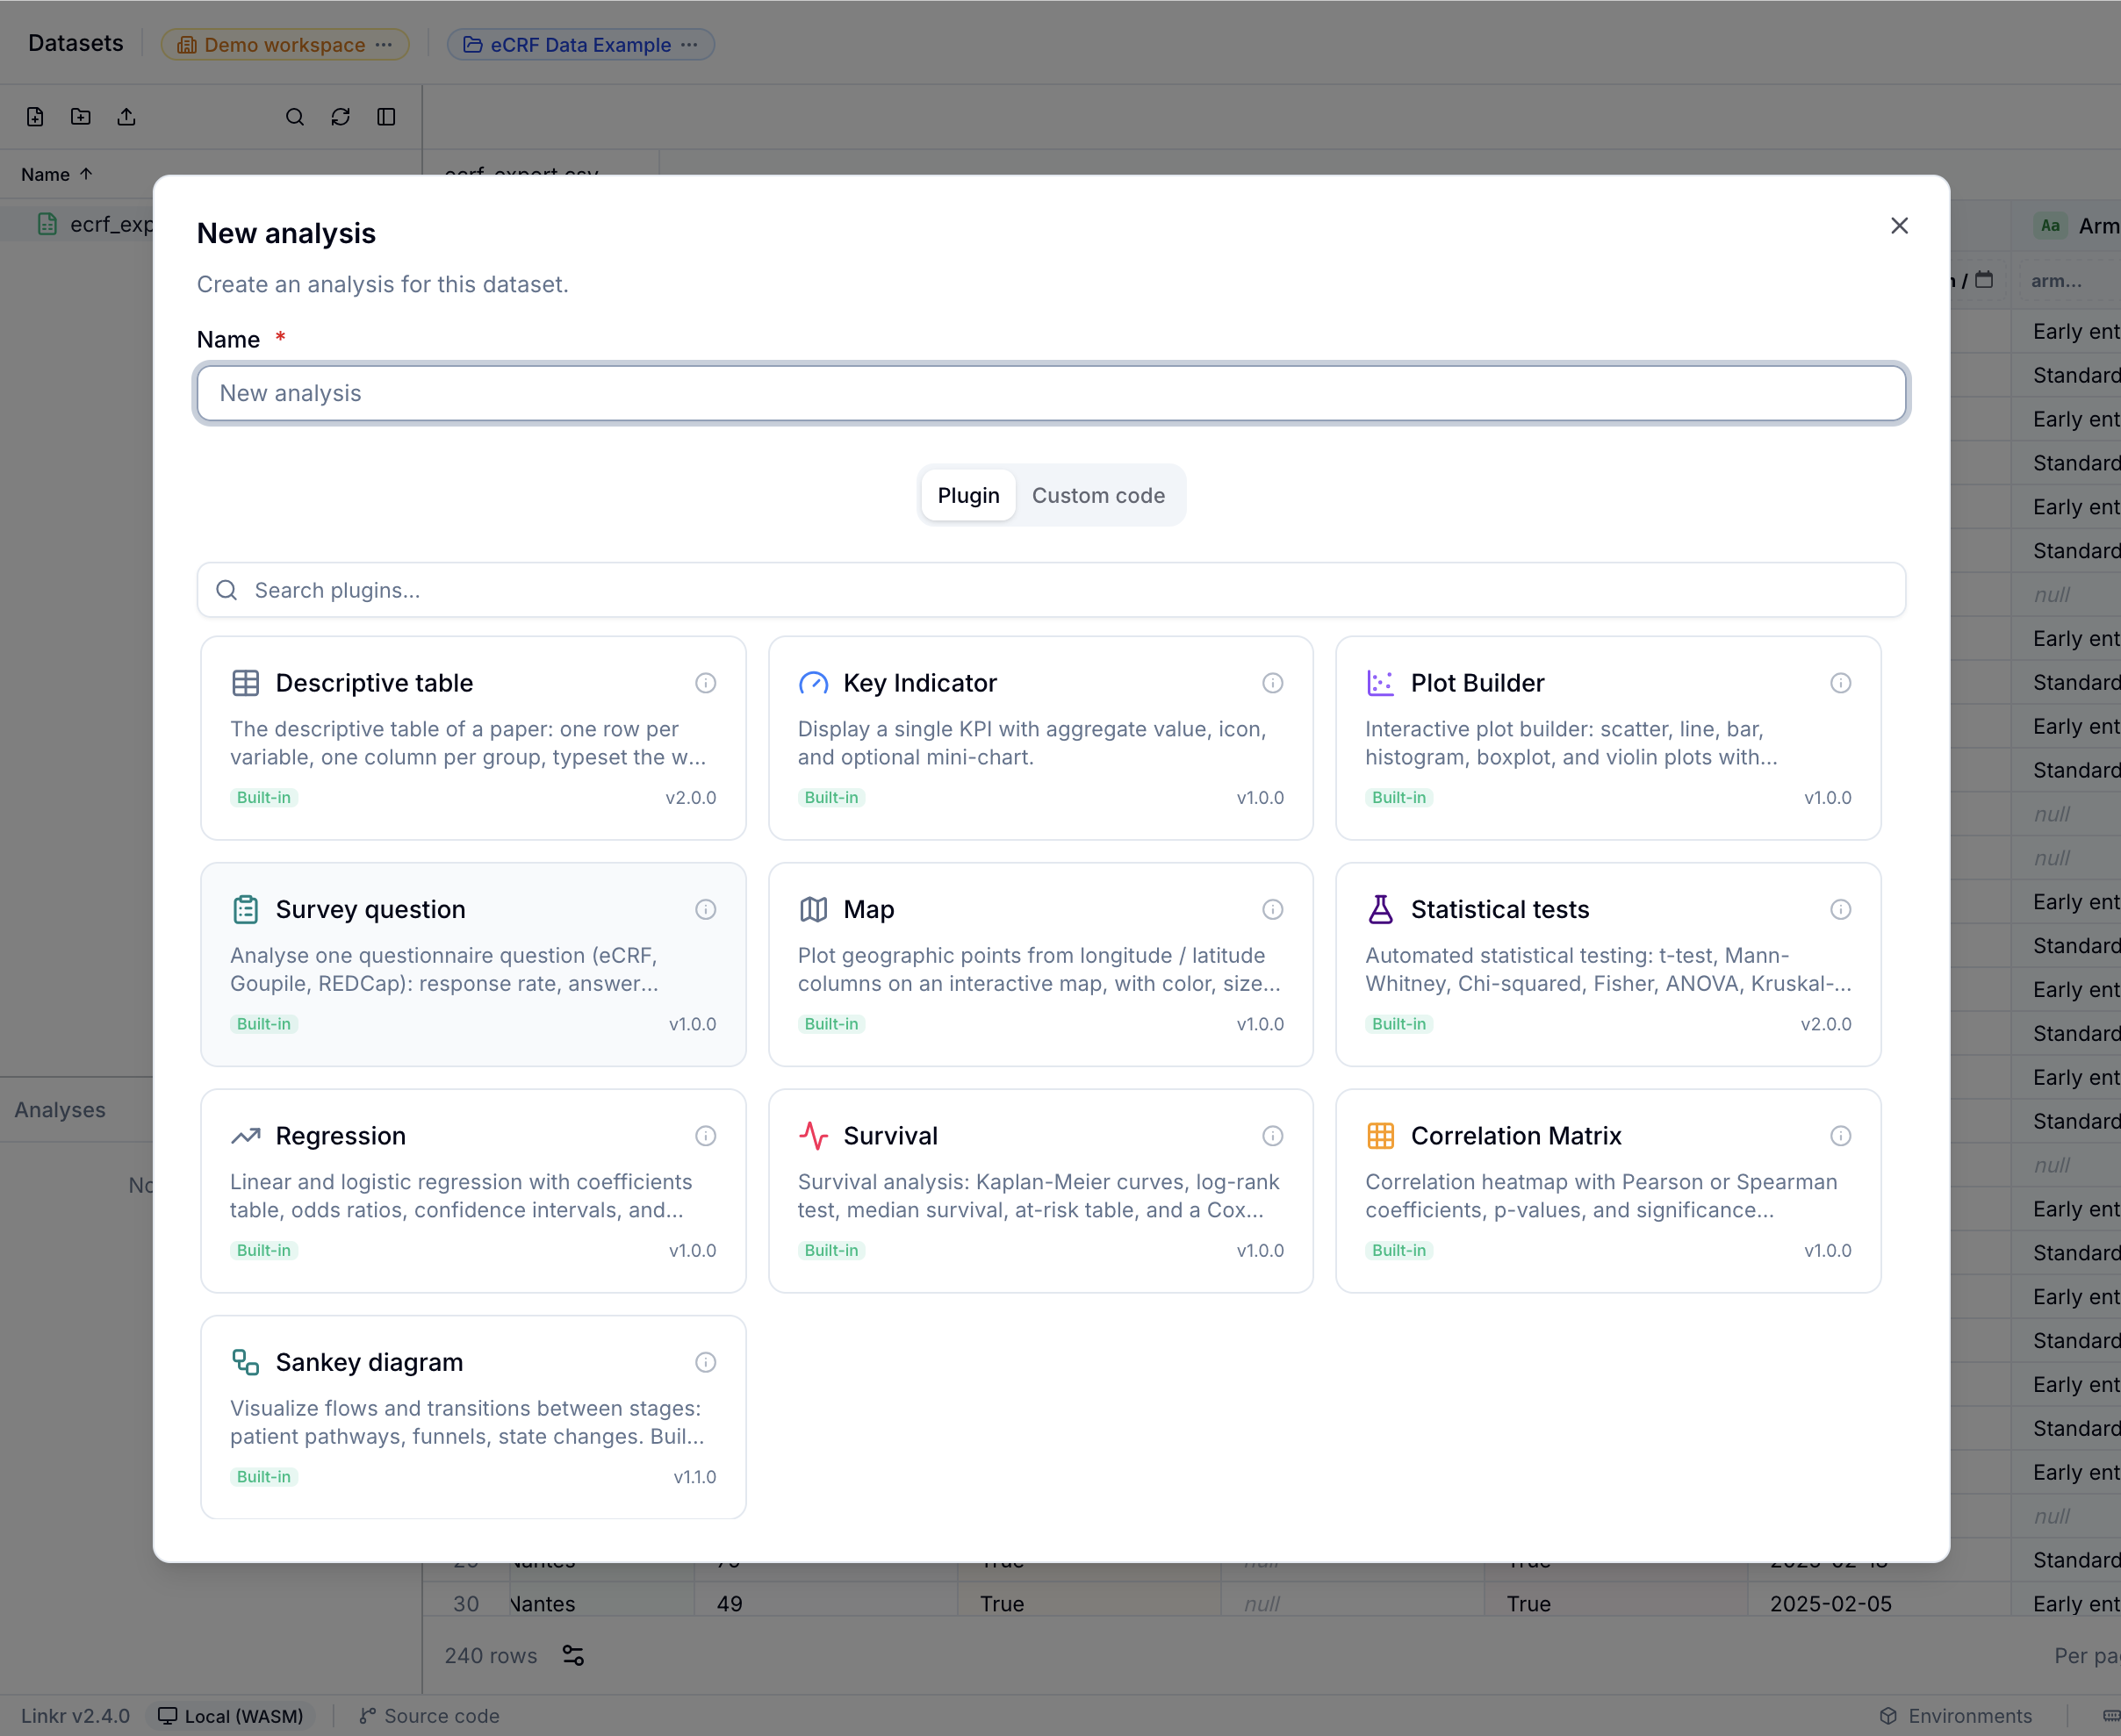
The Survey question plugin takes one question and gives the reading a collection calls for: the response rate, the number of missing values, and the distribution of answers — histogram and median for a numeric question, breakdown by category for a multiple-choice one.
In the screenshot at the top of this page, the age question shows a
81.3% response rate: 195 answered, 45 missing, with a median of 52. That is
exactly what you want to know first about a collection — before analysing the answers, knowing
whether they are there.
From collection to dashboard
An analysis attached to the dataset answers a one-off question. To follow a collection while it runs — inclusions per centre, completeness per form — those same widgets go on a dashboard, which recomputes with every new export.
Going further
- Build a dashboard — follow a collection continuously rather than at a single point in time.
- Manual data collection — why an eCRF rather than a spreadsheet, and how to structure your form.
- Data quality — what the response rate tells you, and the other checks worth running.