Summary
Around the OMOP model, the OHDSI community has built a coherent suite of open source tools covering the full lifecycle of a study: preparing data (WhiteRabbit, Rabbit-in-a-Hat, Usagi), exploring medical concepts (ATHENA), defining cohorts and analyses without coding (ATLAS), checking data quality (ACHILLES, DQD), and running advanced R analytics (HADES). On top of that, a Docker installer (Broadsea), a network-study orchestrator (Strategus) and a teaching dataset (Eunomia). This article paints a portrait of each tool and how they fit together.
An integrated suite, not isolated tools
At first glance, the list of OHDSI tools can be overwhelming. But they’re not independent projects — together they form a coherent pipeline that follows the lifecycle of an observational study.
A typical path follows four stages:
Prepare the database
Understand the source data, design the ETL, map local codes to standard vocabularies.
Explore vocabularies
Pick the right standard concepts to define cohorts.
Define and analyze
Create cohorts, characterize populations, estimate effects, build prediction models.
Check quality
Verify that the data follows OMOP conventions before running analyses or sharing the database with partners.
Each OHDSI tool covers a part of this journey. They all communicate through the common format: the OMOP CDM model.
The Book of OHDSI as reference
This article is a panorama. For each tool, the official documentation is in the Book of OHDSI — free, in English. Chapter 6 (ETL), Chapter 8 (Analytics Tools), and Chapter 9 (SQL and R) are the entry points.
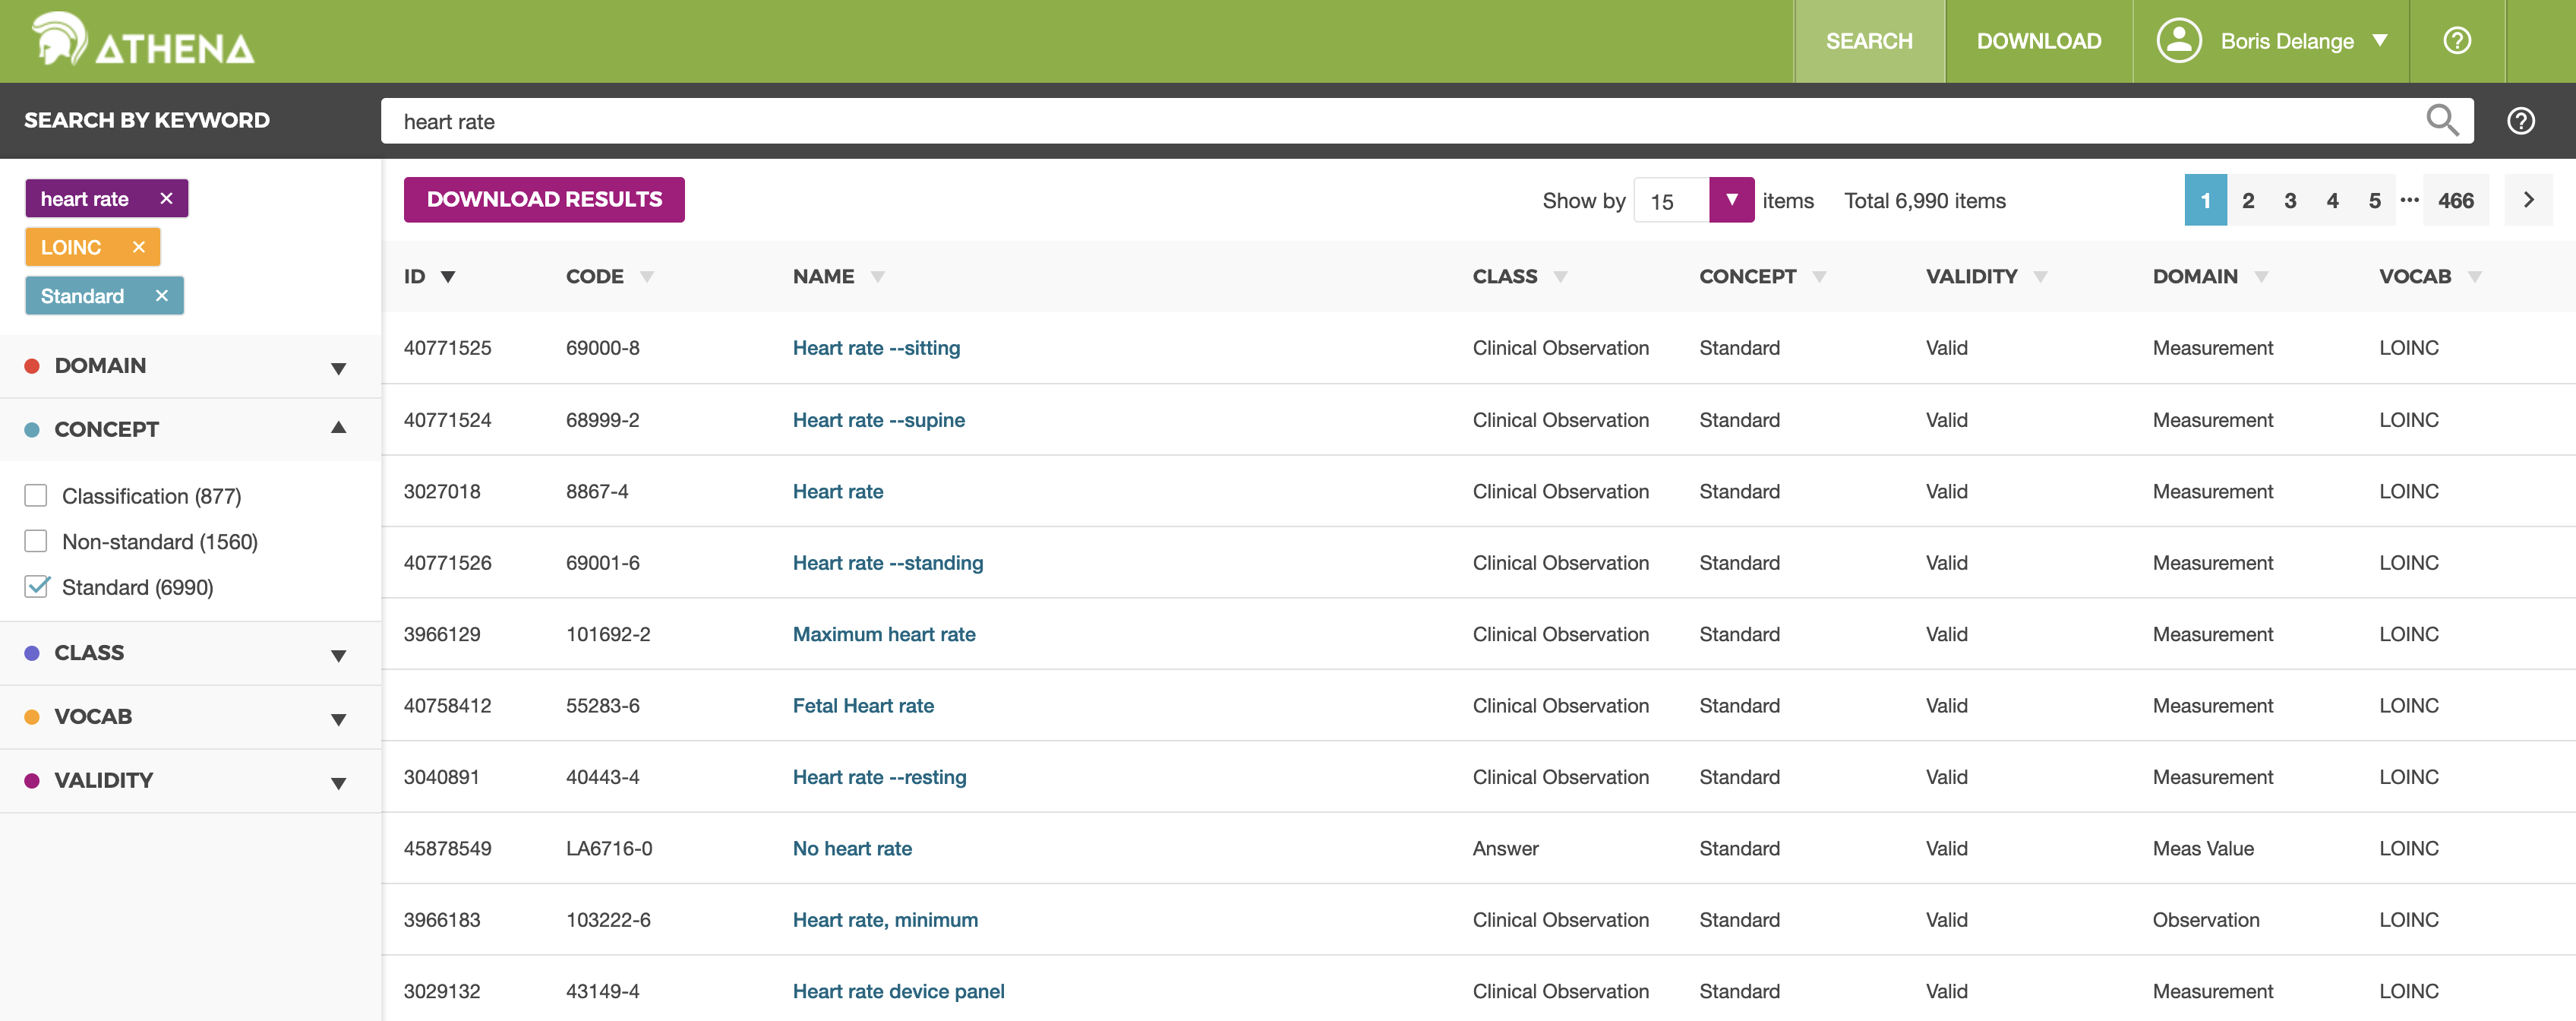
ATHENA — the concepts dictionary
ATHENA is the reference dictionary for OMOP standardized vocabularies. It is the very first tool you will open — often even before having data.
- Role:
- Online dictionary to browse OMOP standard concepts and download vocabulary subsets.
- Active period:
- 2015 — 2025 (still maintained)
- Links:
- Live app · Source code (74 ★)
ATHENA gives access to the full set of vocabularies integrated by OHDSI — SNOMED CT, LOINC, RxNorm, ATC, ICD-10, ICD-9, MeSH, and many more. The exact list evolves with each update. For each concept, you can consult:
- Its OMOP standard identifier (concept_id), to use in your queries
- Its synonyms in several languages
- Its relationships to other concepts (parent/child, equivalence, mapping)
- Its domain (Condition, Drug, Measurement, Procedure…)
- Its hierarchy (for example, Type 2 diabetes is a child of Diabetes)
Without an account, the dictionary is browsable in read-only mode. With a free account, you can download vocabulary subsets to import into your own OMOP database — a required step to make ATLAS or the other tools work.
Preparing the ETL: WhiteRabbit, Rabbit-in-a-Hat, Usagi
Three OHDSI tools support the ETL preparation phase — the conversion of your source database into OMOP. All are desktop applications (Java, cross-platform).
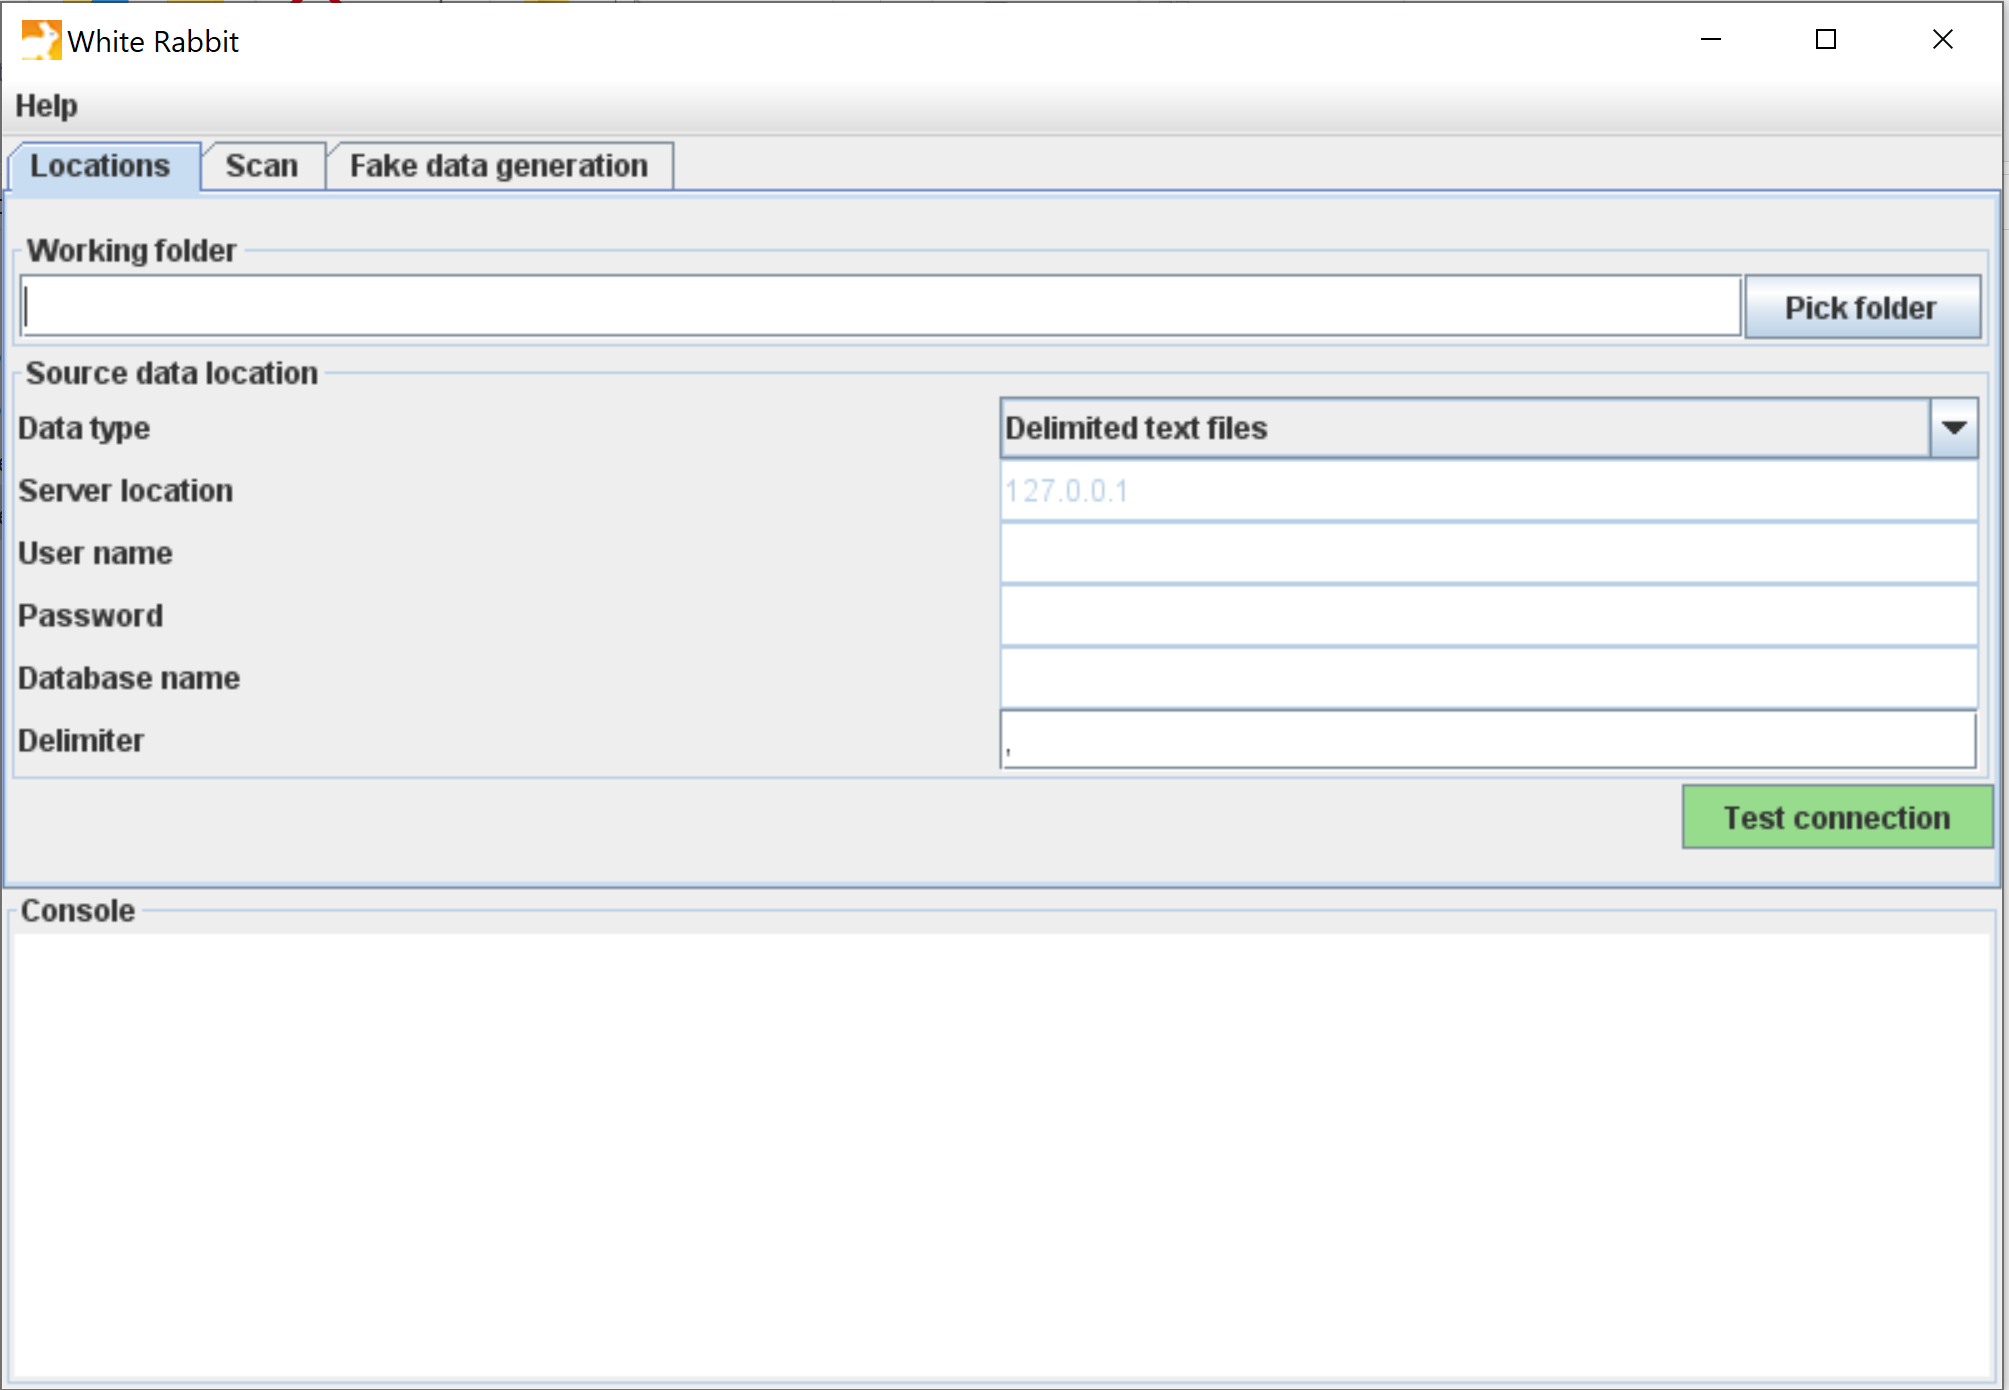
WhiteRabbit — scan source data
WhiteRabbit is the first tool you will run.
- Role:
- Desktop application (Java) that scans a source database and produces an aggregate profiling report.
- Active period:
- 2014 — 2025 (still maintained)
- Links:
- Source code (215 ★)
It scans your source database (CSV, Oracle, SQL Server, PostgreSQL…) and produces a detailed Excel report: tables, columns, data types, value distributions, frequencies. It is essentially automated data profiling.
The report contains only aggregate statistics, therefore anonymous: it can be safely shared with external collaborators, with no confidentiality constraints.
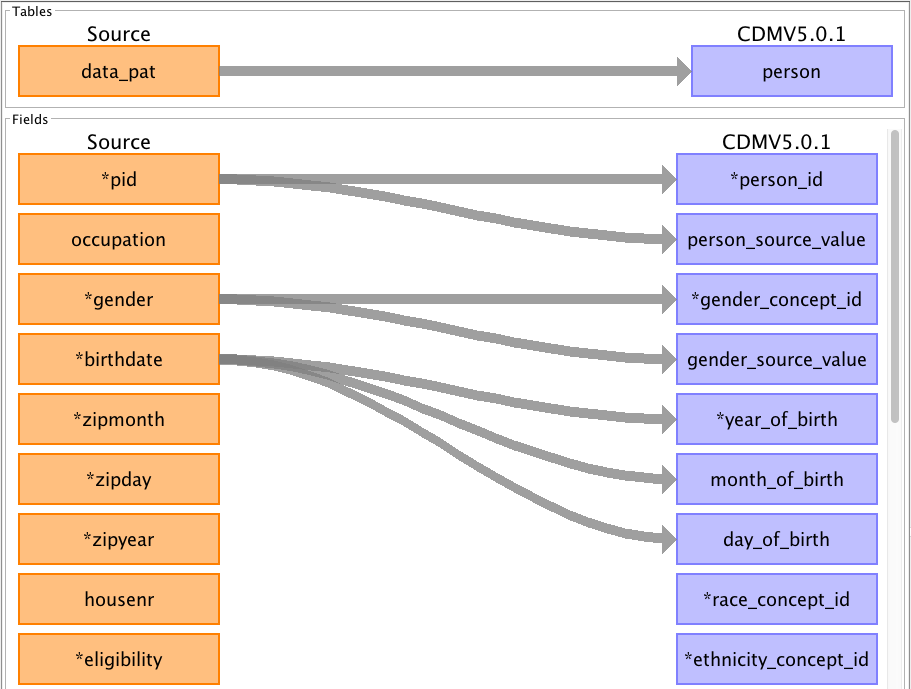
Rabbit-in-a-Hat — design the table-to-table mapping
Building on the WhiteRabbit report, Rabbit-in-a-Hat (available in the same repository) provides a graphical interface to draw the mapping from your source database to OMOP. You connect your source tables to OMOP tables, your source columns to OMOP columns, and document the transformation logic.
The result is an ETL specification document that guides the actual implementation (in SQL, Python, or R).
- Role:
- Desktop application (Java) to graphically draw the table-to-table mapping from a source database to OMOP.
- Active period:
- 2014 — 2025 (shared with the WhiteRabbit repository, still maintained)
- Links:
- Source code (shared with WhiteRabbit)
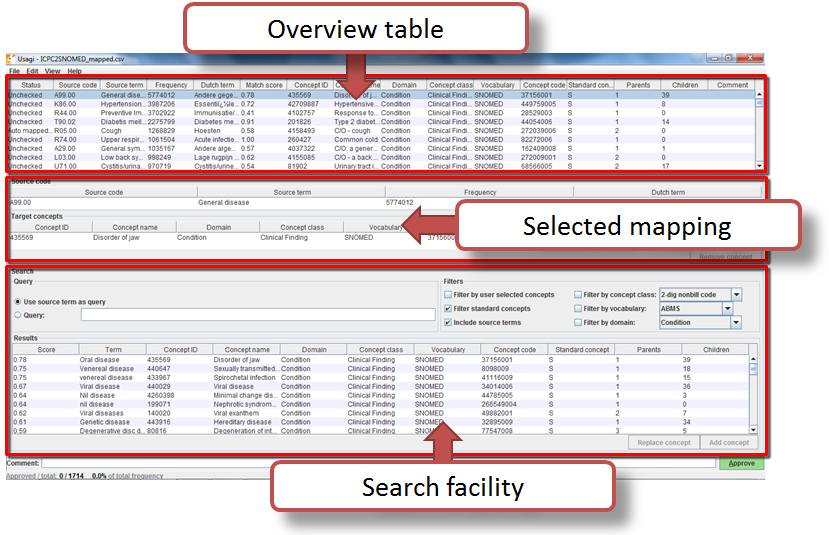
Usagi — map codes to standard concepts
Once the structure is mapped, local codes (for example, an internal service code, a free-text medication name) still need to be converted to OMOP standard concepts. That’s the role of Usagi.
- Role:
- Desktop application (Java) that suggests, through text similarity, the closest standard concepts for local codes to be mapped.
- Active period:
- 2014 — 2024 (last public update in 2024)
- Links:
- Source code (113 ★)
Usagi takes your list of local codes and, for each one, suggests the closest standard concepts using text-similarity algorithms. You validate, correct, or reject each suggestion. The output is exported to the OMOP SOURCE_TO_CONCEPT_MAP table, which is designed specifically to host these local mappings.
ATLAS — the web platform
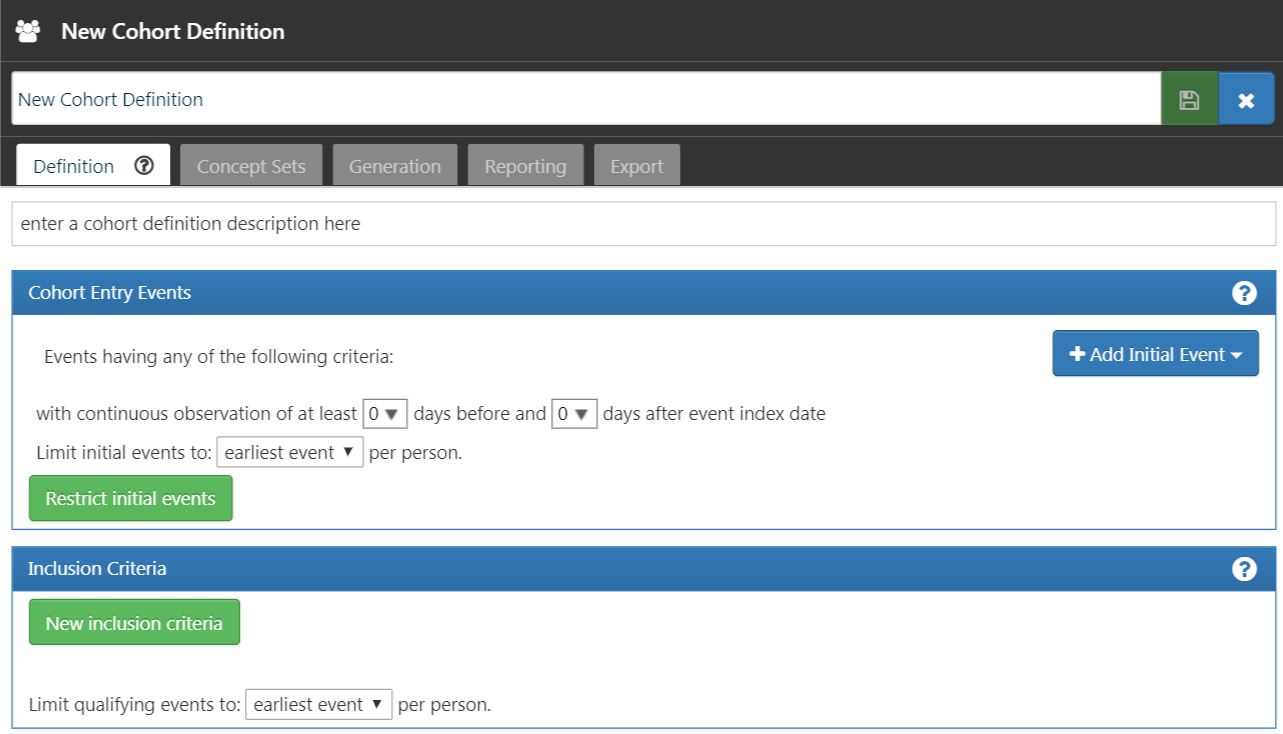
ATLAS is the flagship OHDSI tool: a full web platform that lets you design and run analyses on an OMOP database without writing code. It is the most visible tool in the community, the one most clinical researchers discover first.
- Role:
- Web platform to define cohorts, concept sets, characterizations and studies — without code. User interface for WebAPI and HADES.
- Active period:
- 2015 — 2026 (very active)
- Links:
- Public demo · Source code (315 ★)
ATLAS lets you, through a graphical interface:
- Explore vocabularies locally (an ATHENA-equivalent within your database)
- Define concept sets (reusable concept groups, e.g. “all antidiabetics” or “heart rate” under all of its codes — a single clinical concept can be covered at multiple levels of scale and granularity)
- Create cohorts from time-based inclusion/exclusion criteria
- Characterize populations (demographics, comorbidity prevalence…)
- Estimate effects (treatment comparisons with adjustment)
- Build prediction models (machine learning on cohorts)
- Generate SQL automatically, runnable on any OMOP database
ATLAS is the user interface for a deeper analytics layer (HADES, below). You can test ATLAS without installation through the public OHDSI demo running on synthetic data.
Assessing quality with ACHILLES and the DQD
Once your OMOP database is built, how do you check that it’s correct? Two complementary tools handle this.
ACHILLES — characterize the database
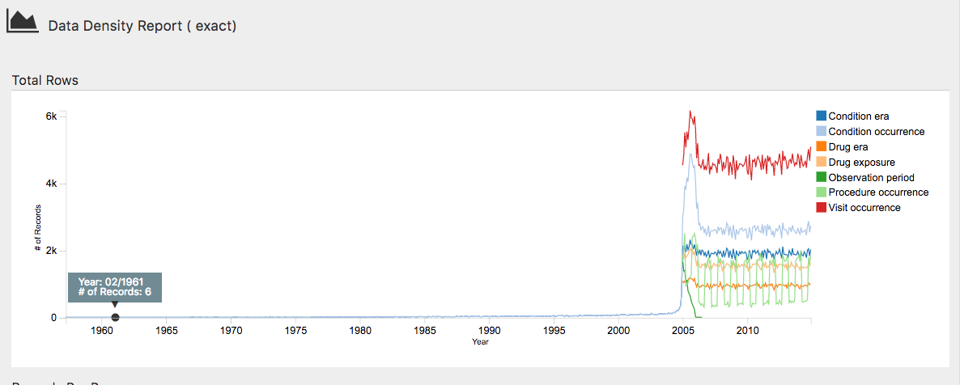
ACHILLES (Automated Characterization of Health Information at Large-scale Longitudinal Evidence Systems) is an R package that scans an entire OMOP CDM database and produces a synthetic report: patient counts, age and sex distributions, condition prevalences, medication frequencies, lab measurement distributions…
- Role:
- R package that characterizes an OMOP database (volumes, distributions, prevalences). The output is viewable through ATLAS.
- Active period:
- 2014 — 2025 (still maintained)
- Links:
- Source code (147 ★)
The result is viewable through ATLAS, which integrates ACHILLES visualizations. It is the reference tool to familiarize yourself quickly with a new OMOP database.
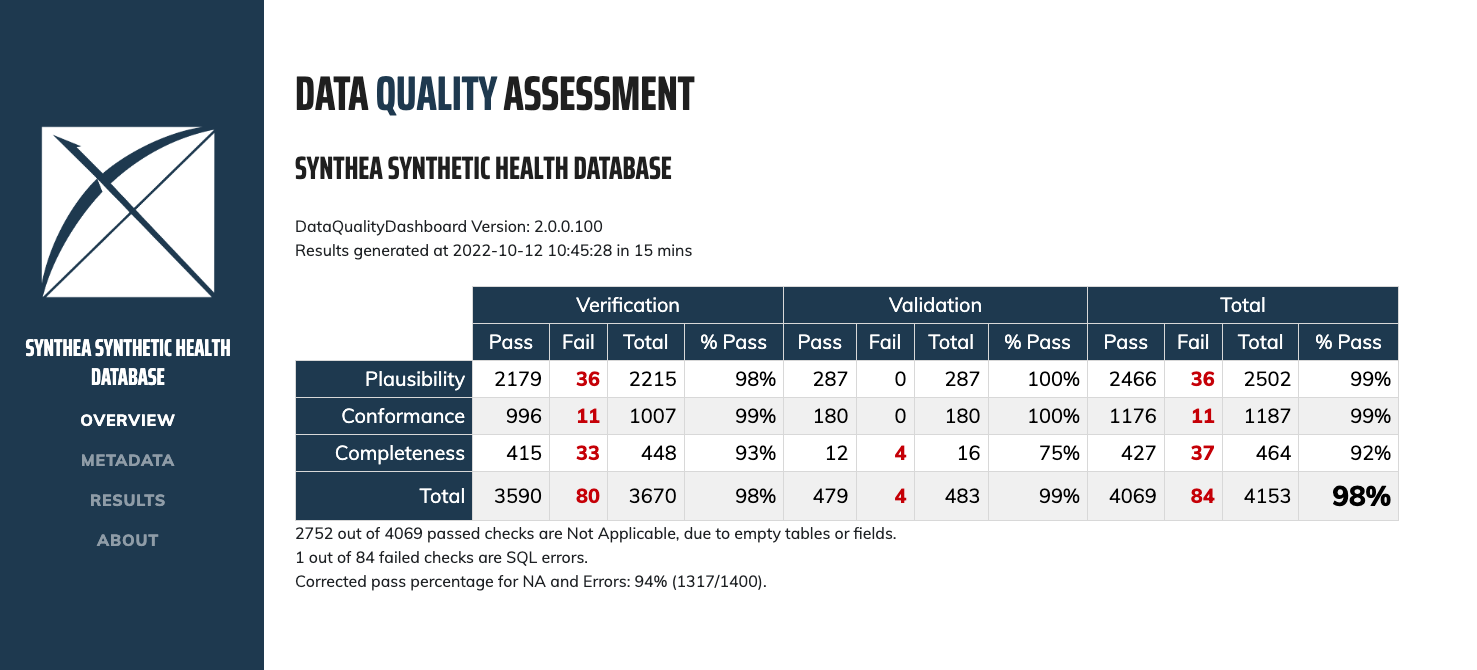
Data Quality Dashboard — verify OMOP conventions
The Data Quality Dashboard (DQD) goes further:
- Role:
- R package that runs several thousand automated checks on an OMOP database and produces an HTML dashboard.
- Active period:
- 2019 — 2026 (very active)
- Links:
- Source code (176 ★)
It runs thousands of automated checks on your OMOP database to verify that it follows the model’s conventions. The checks are organized according to the three high-level categories of the Kahn framework, adopted officially by the DQD documentation:
- Conformance — data types, keys and schema constraints are respected.
- Completeness — required fields are not empty.
- Plausibility — values are within realistic ranges (e.g., no 200-year-old patients, no death date earlier than birth date).
The interactive HTML report makes it easy to spot priority issues before the database is used for any analysis.
HADES — large-scale R analytics
HADES (Health Analytics Data-to-Evidence Suite) is the set of official OHDSI R packages for programmatic observational research.
- Role:
- Meta-package that bundles and coordinates the full set of OHDSI’s official R packages for observational research.
- Active period:
- 2020 — 2026 (very active; individual packages active since 2014)
- Links:
- Documentation · Source code (28 ★; individual packages have their own repos, e.g. PatientLevelPrediction 216 ★, CohortMethod 89 ★)
These packages are organized into coherent blocks:
DatabaseConnectorandSqlRender— abstraction layer to run SQL on any OMOP database (PostgreSQL, SQL Server, Oracle, BigQuery, Redshift…).CohortGeneratorandCohortMethod— cohort creation and comparison.Characterization— automated cohort description.PatientLevelPrediction— patient-level validated prediction models.SelfControlledCaseSeries,Cyclops,MethodEvaluation— advanced statistical methods.
HADES is the go-to tool for data scientists and statisticians working with OMOP. It is also the engine behind ATLAS: whenever you generate an analysis via ATLAS, HADES code is what ultimately runs.
The central documentation covers all the packages.
Other tools worth knowing
Beyond the tools described above, several others deserve a mention — either because they’re part of teams’ daily routine, or because you’ll come across them in documentation or existing deployments.
Deployment and orchestration
- Broadsea — the official Docker installer for the OHDSI ecosystem. A single command deploys ATLAS, WebAPI, HADES in RStudio, Ares, and several optional services. It is today the standard way to set up OHDSI inside an institution.
- Strategus — an R orchestrator that chains HADES modules together to design, run, and share network studies across sites. It is the modern packaging format for an OHDSI study, gradually replacing the older hand-rolled study packages.
- Ares — a web interface to browse ACHILLES and DQD results across a network of OMOP databases, with site-to-site and release-to-release comparisons.
Learning and testing
- Eunomia — a small OMOP dataset distributed as a SQLite file, used by almost every tutorial and unit test in the ecosystem. Handy for experimenting with HADES without access to a real database.
Defining and validating cohorts
- CohortDiagnostics — an R/Shiny tool to diagnose the quality of a cohort definition: attrition flow, orphan codes, incidence, cross-database comparisons.
- PhenotypeLibrary — a community-curated library of validated and versioned cohort definitions (with DOIs), reusable from one study to the next.
- Capr — to define cohorts programmatically in R, as an alternative to the ATLAS GUI.
- PHOEBE — an assistant that, from a given concept, suggests related concepts you might be forgetting to include in a concept set. Integrated directly into ATLAS from version 2.12.
ETL quality on the EHDEN side
- CdmInspection — an R package maintained by the EHDEN foundation (not OHDSI directly) that produces an inspection report for an OMOP database. Used in the onboarding process for European data partners.
Everything is open source
The entire source code of these tools is at github.com/OHDSI, under the Apache 2.0 license. This means:
- You can read the code, understand exactly how each analysis is computed.
- You can contribute fixes or features.
- You can fork a tool for your own needs, including commercial use.
The community welcomes external contributions through pull requests, with a documented review process. The most active tools (ATLAS, HADES) receive contributions every month.
Going further
This article is a panorama. To go deeper:
- The Book of OHDSI is the reference documentation. Chapter 6 for ETL (WhiteRabbit, Usagi…), Chapter 8 for ATLAS and the Methods Library, Chapter 9 for SQL and R.
- The EHDEN Academy offers free online courses for each tool — the best practical starting point for beginners.
- The public ATLAS demo lets you test without installing anything.
- The OHDSI GitHub centralizes every repository, with README and examples for each tool.
- The OHDSI ecosystem is not a collection of independent tools — it's a coherent suite covering the full lifecycle of an observational study: prepare, explore, analyze, check.
- ATHENA is the standardized concepts dictionary — the first tool to consult, with or without data.
- WhiteRabbit + Rabbit-in-a-Hat + Usagi support the ETL phase: scan data, map tables, map codes.
- ATLAS is the flagship web platform: define cohorts, characterize, estimate, predict — without coding.
- ACHILLES and the Data Quality Dashboard ensure the OMOP database respects the model's conventions before any analysis is run.
- HADES bundles the full set of OHDSI's official R packages for programmatic analyses — and is also the engine behind ATLAS.
- To deploy the ecosystem, Broadsea provides a ready-to-use Docker installer; for network studies, Strategus is the recent packaging format.
- Everything is open source on GitHub, Apache 2.0 licensed, with free documentation (Book of OHDSI, EHDEN Academy).