Summary
The OMOP CDM has become the global standard for structuring observational healthcare data. Born from an American pharmacovigilance project in the wake of the FDA Amendments Act of 2007, its purpose was simple: enable analyses to be compared across different databases. A landmark network study published in 2016 proved that the approach worked — and paved the way for everything that followed.
What you already know
If you’ve followed the articles in the Understanding health data warehouses section, you already have good intuition about the problems OMOP solves:
- Healthcare data is scattered across multiple hospital software systems, each with its own format (first article).
- To use it for research, data must be gathered into a clinical data warehouse through an ETL process (third article).
- This data is organized in related tables in long format (fifth article).
- Each hospital uses different codes for the same thing — hence the need for standardized terminologies (sixth article).
OMOP addresses all of these problems: a common data model that defines both the structure of tables (structural interoperability) and the vocabularies to use (semantic interoperability).
But to understand why OMOP prevailed, we need to go back to its origins.
The origins: the OMOP project
A pharmacovigilance problem
In the United States, the FDA Amendments Act of 2007 mandated the FDA to develop a system for using already-collected healthcare data to identify risks associated with marketed drugs (Stang et al., 2010).
The underlying question: can we use healthcare data already collected routinely (insurance claim databases, hospital records, registries) to detect drug adverse effects before a disaster occurs?
The creation of the OMOP project
It was in this context that the OMOP project was launched, as a public-private partnership chaired by the FDA, administered by the FNIH, and funded by a consortium of pharmaceutical industry organizations (Stang et al., 2010).
OMOP set itself a two-year programme to empirically test which statistical methods can reliably detect drug–event associations from claims databases and electronic health records (Stang et al., 2010). More than ten categories of methods (disproportionality analyses, case-control approaches, propensity scoring, sequential methods…) were compared on a shared set of test cases.
The test cases covered known associations used as references — for example the risk of angioedema under angiotensin-converting enzyme inhibitors, haemorrhage under warfarin, or acute liver injury under certain antibiotics — to measure each method’s ability to recover these signals. The programme also evaluated beneficial associations, such as the reduction in post-infarction mortality with beta-blockers.
The Common Data Model
To compare methods across different databases, OMOP researchers needed a common format. They therefore created the Common Data Model (CDM): a relational schema into which all partner databases had to transform their data (Stang et al., 2010).
Heterogeneous source databases
Hospital A warehouse
patient_id, dx_icd10, dx_date
Hospital B warehouse
mrn, diagnosis, icd_code, dt
Insurance claims database
member_id, claim_code, period
National registry
registry_id, cond_code, occured_on
to CDM
OMOP CDM format
condition_occurrence
person_id, condition_concept_id,
condition_start_date,
condition_source_value, …
Same tables, same columns, same standard vocabularies — whatever the source database.
The CDM rests on a few key principles, later articulated in the Book of OHDSI:
- Patient-centered: every clinical event is attached to a patient and dated.
- Semantically standardized: each hospital’s local codes are converted to standard vocabularies (SNOMED CT for diagnoses, RxNorm for medications, LOINC for lab tests…). Stang et al. note as early as 2010 the integration of ICD-9, CPT-4, SNOMED, and LOINC.
- Technology-agnostic: the model can be implemented on any relational database (PostgreSQL, SQL Server, Oracle, BigQuery…).
- Traceable: original source codes are preserved alongside standard codes. Stang et al. state that the CDM “does not alter the content of the data”.
These choices are detailed in a later article on the structure of the CDM.
The project’s results
The OMOP project delivered two structural contributions for what followed:
- An empirical evaluation of safety signal detection methods, run on 10 databases covering more than 130 million patients through the CDM (Ryan et al., 2012) — demonstrating the feasibility of large-scale analyses across heterogeneous sources.
- The first versions of the Common Data Model and its standardized vocabulary system, which OHDSI would later take up and extend from 2014 onward.
When the OMOP project concluded, the community that had formed around it chose to continue the work as a permanent organization, founded in 2014: OHDSI. We cover it in the next article.
A new era: Hripcsak 2016 and OHDSI’s first international network study
In 2016, the OHDSI community — which emerged from OMOP and was founded in 2014 — took a new step with an international study published in the Proceedings of the National Academy of Sciences (Hripcsak et al., 2016). Where Ryan et al. had proven that statistical methods worked on a database network, Hripcsak et al. used that network to answer a real question of clinical practice: how are patients with type 2 diabetes, hypertension, or depression actually treated across the world?
The study covered 11 data sources across 4 countries (United States, United Kingdom, Japan, South Korea), totalling more than 250 million patients, providing what the authors themselves described as a previously unavailable insight into clinical practice.
The technical principle: each institution executed the same analysis code on its own data, in OMOP CDM format. The aggregate results were then consolidated at the international level. No patient data ever moved between centres.
The result was striking: for three conditions covered by international guidelines, prescription strategies varied considerably from one country to another. More than 10% of patients with diabetes or depression — and nearly 25% for hypertension — followed a treatment pathway unique within the entire cohort, never observed in any other patient. For diabetes, metformin clearly dominated first-line therapy in line with guidelines, but with highly variable adoption rates across databases.
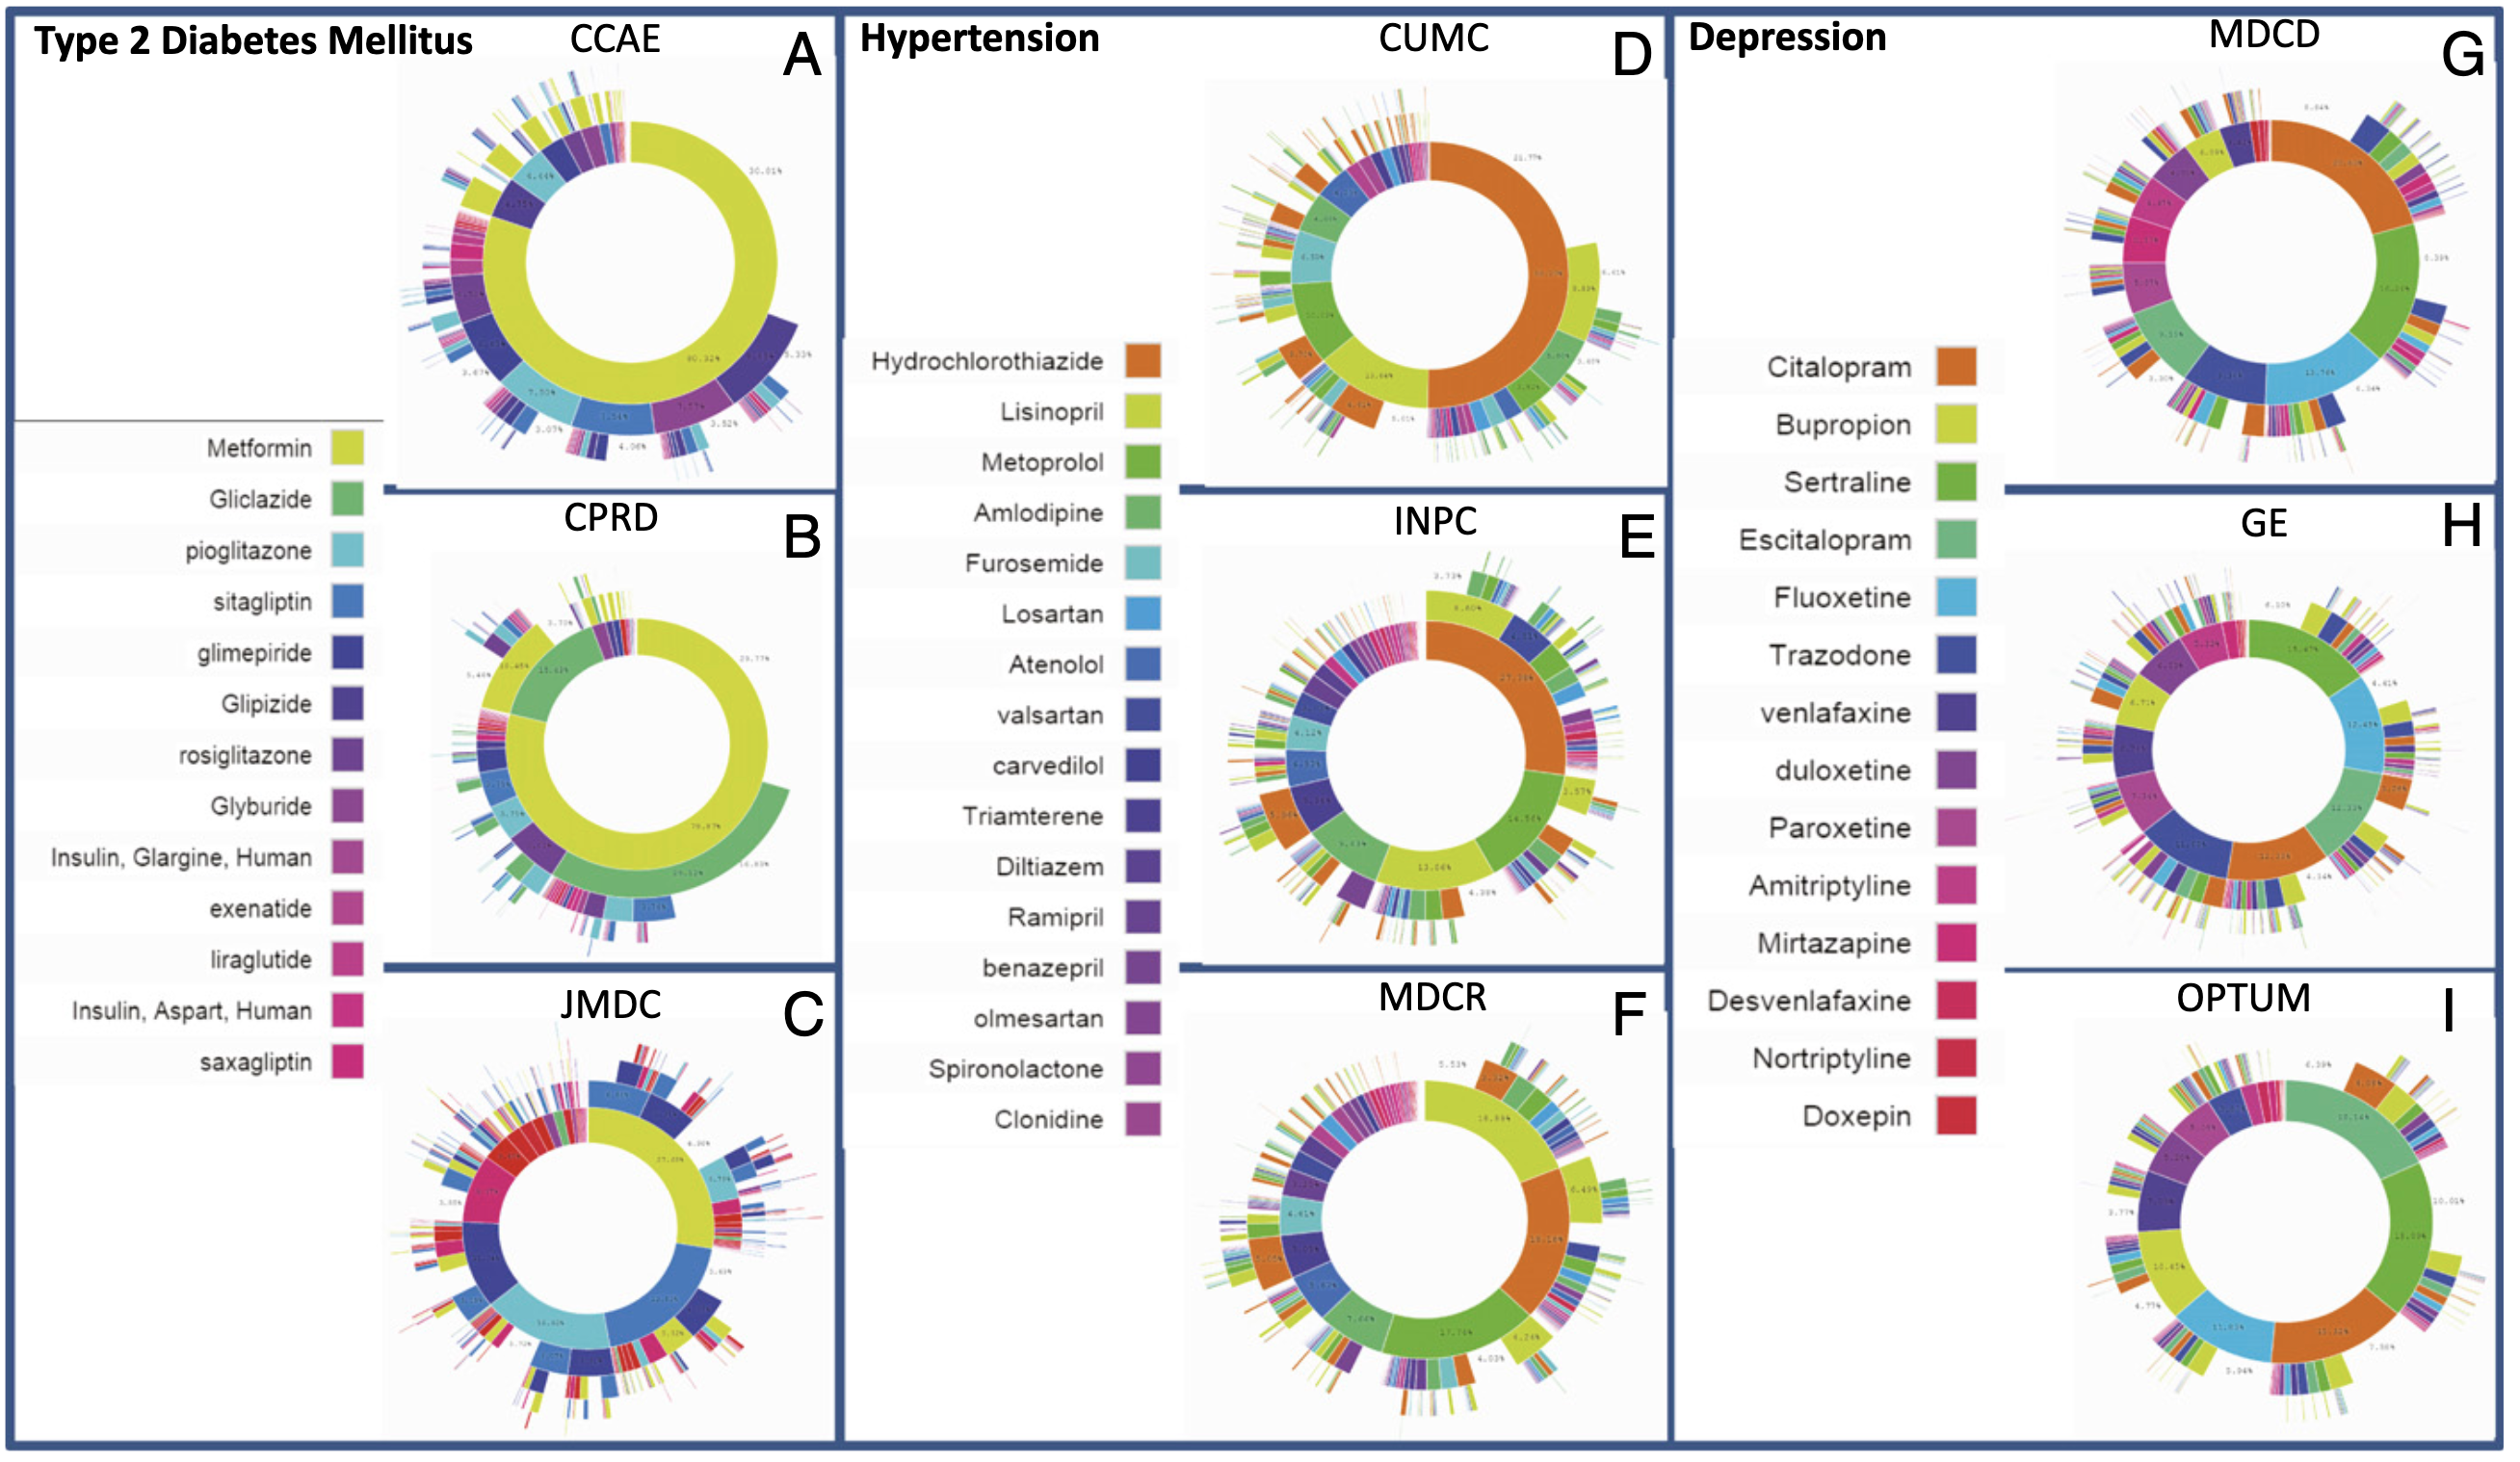
Figure 3 from Hripcsak et al., 2016. For each disease — diabetes (A-C), hypertension (D-F), depression (G-I) —, the inner circle of each sunburst shows the first medication prescribed, the next circle the second, and so on. Three data sources are shown per disease. The clear dominance of metformin for diabetes stands out, contrasting with the fragmented choices for hypertension and the even greater diversity for depression. Click the image to zoom.
Why this study mattered
Hripcsak et al. do not merely show that the OMOP model works technically — Ryan et al. had already established that four years earlier. This study proves that an open community can now use it to answer real international clinical questions, without moving patient data. It is the founding act of the large real-world practice studies that would follow.
This study laid the foundations for everything that followed: large-scale comparison studies, real-world regulatory studies, national infrastructures built on OMOP. The rest of this section explores those developments.
And where does Linkr fit in?
Linkr natively supports the OMOP CDM model. The platform allows clinicians to use OMOP-formatted data without needing to master SQL or the technical details of the model — while offering data scientists full access to the CDM for advanced analyses.
- OMOP was born from an American project (chaired by the FDA, administered by the FNIH, funded by a pharmaceutical consortium) addressing a concrete need: detecting drug adverse effects from healthcare data already collected.
- The Common Data Model defines both the table structure (structural interoperability) and the vocabularies to use (semantic interoperability).
- The model is patient-centered, semantically standardized, technology-agnostic, and traceable: local codes are always preserved alongside standard codes.
- Two foundational studies mark OMOP's history: Ryan 2012 proved that statistical methods work across a network of databases; Hripcsak 2016 proved that the OHDSI community can use that network to answer real international clinical questions.
- This sequence legitimized all the infrastructure and community that deployed afterward.